Skip to content

NBA

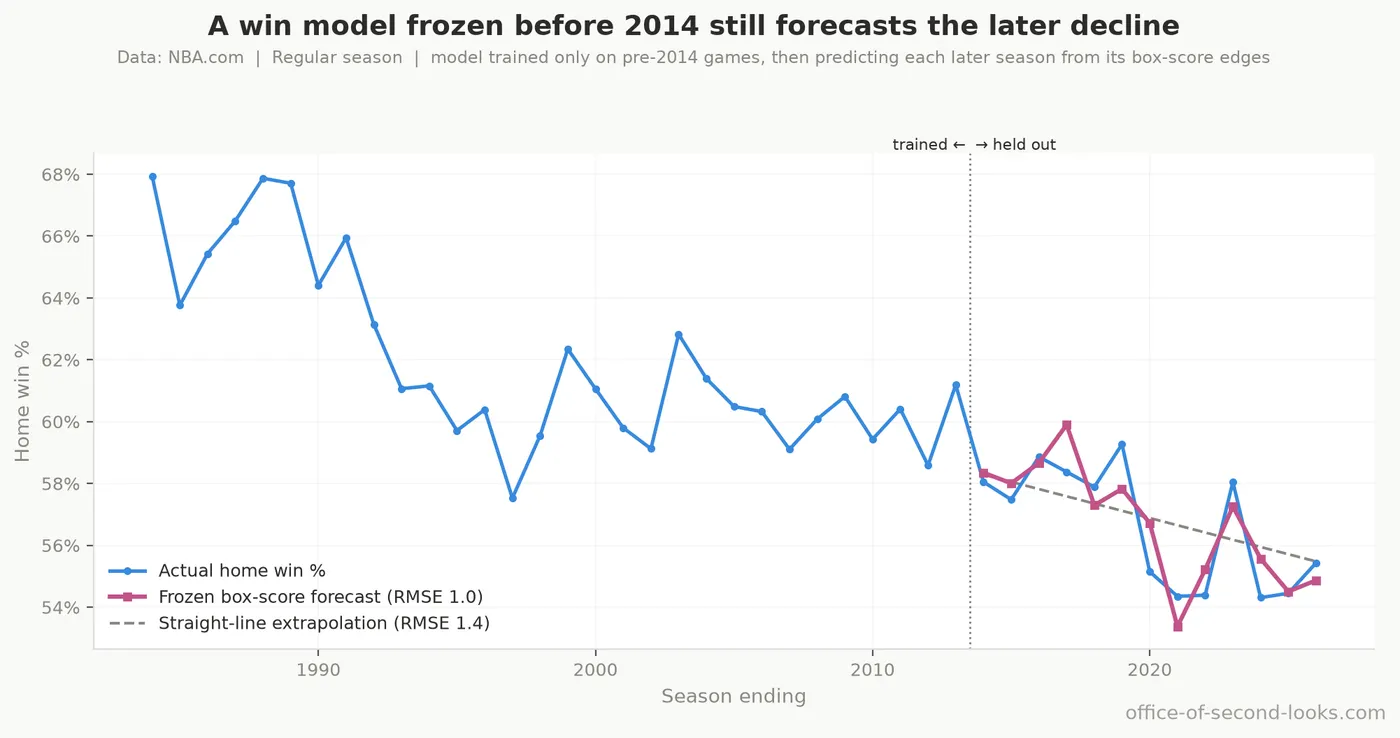
A win model trained only on pre-2014 games, then used to predict each later regular season from its box-score edges. The frozen forecast (pink) tracks the actual home win % (blue) through…

How I Know This Isn't Made Up

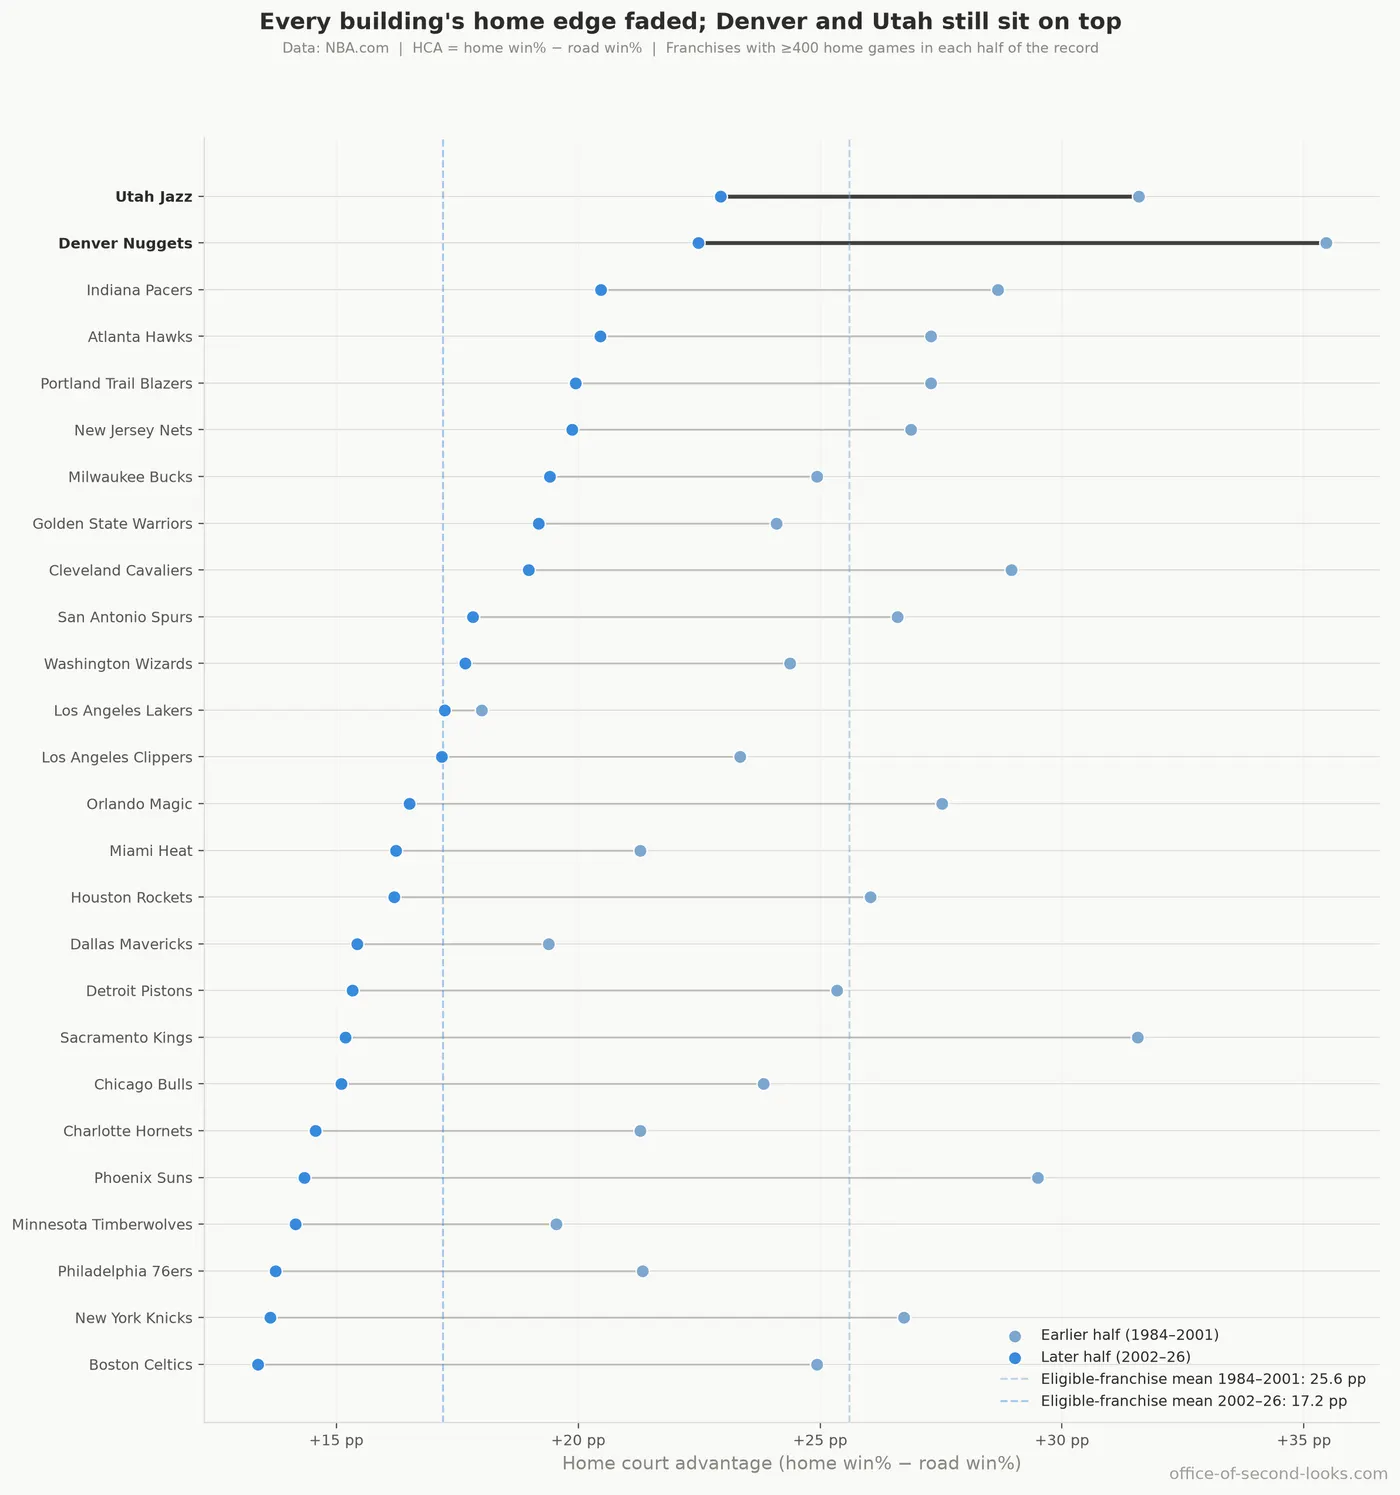
Each franchise’s regular-season home edge in the early era (1984–2001, light blue) and the recent era (2002–26, darker blue), sorted by where they stand today. Denver and Utah (bold) still…

The Altitude Holdouts

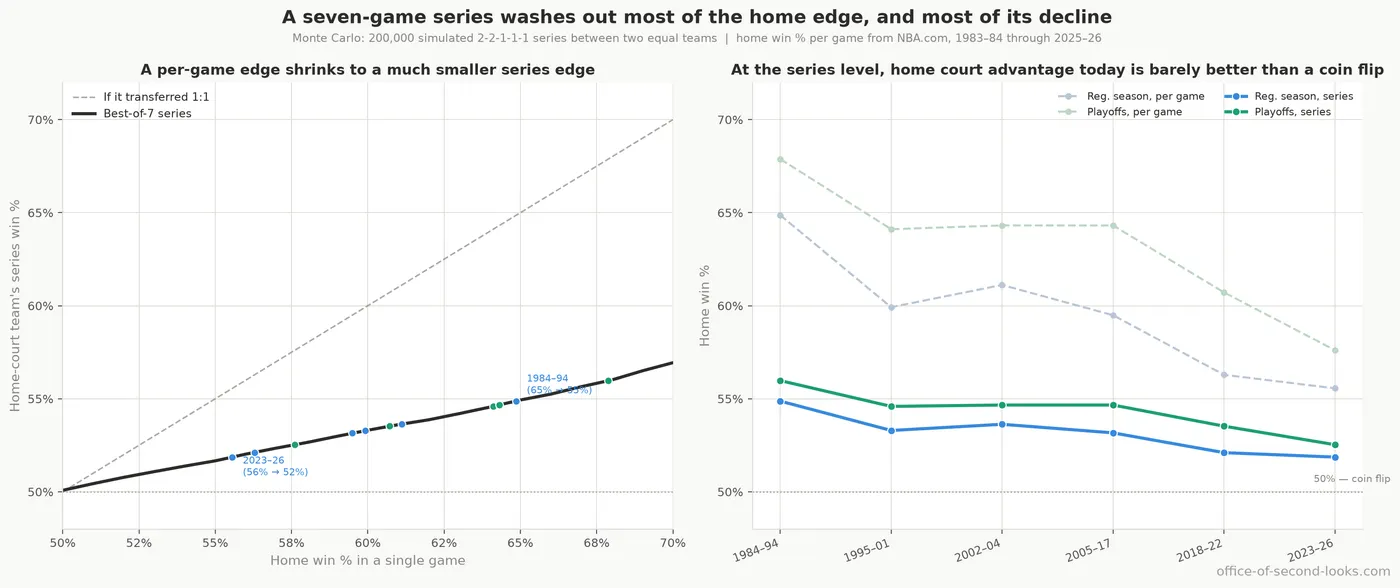
Playoff home win % by game within a series (G1–G7), all eras. The sawtooth tracks who hosts under the 2-2-1-1-1 format: the higher seed hosts G1, G2, G5, and G7 (around 71%), the lower seed…

The Playoffs Are Different (and the Same)

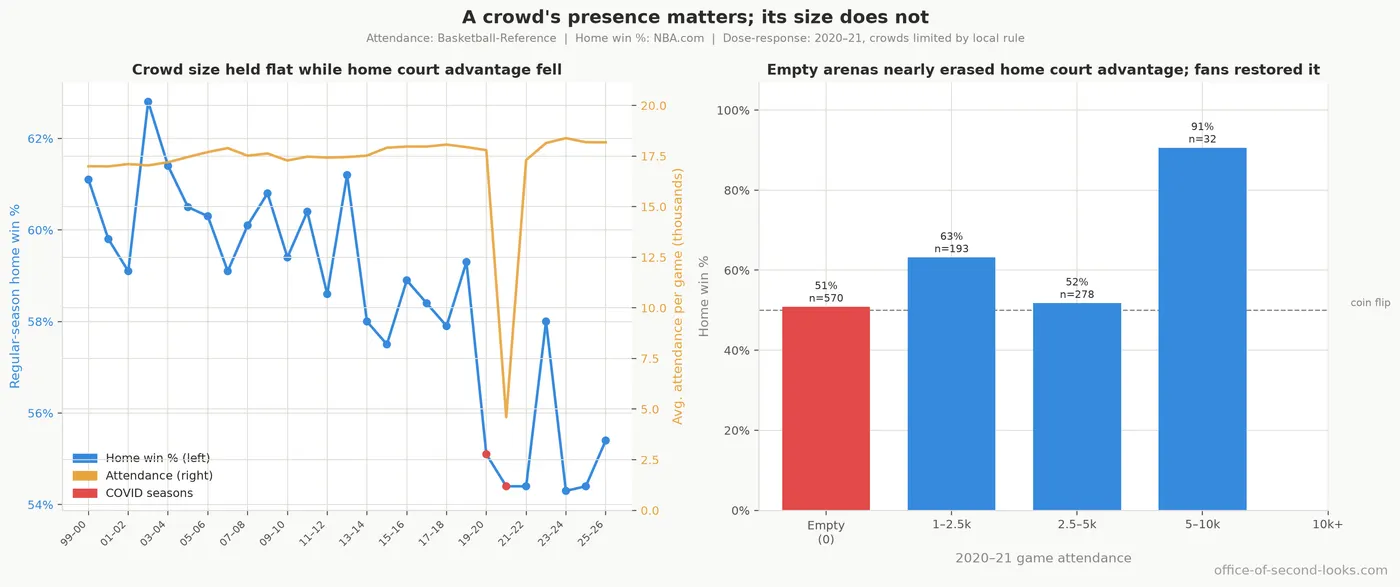
Left: league average attendance per game vs. regular-season home win %, 2000–2026, with crowds holding near capacity while home court advantage keeps falling. Right: 2020–21 home win % by…

The Usual Suspects

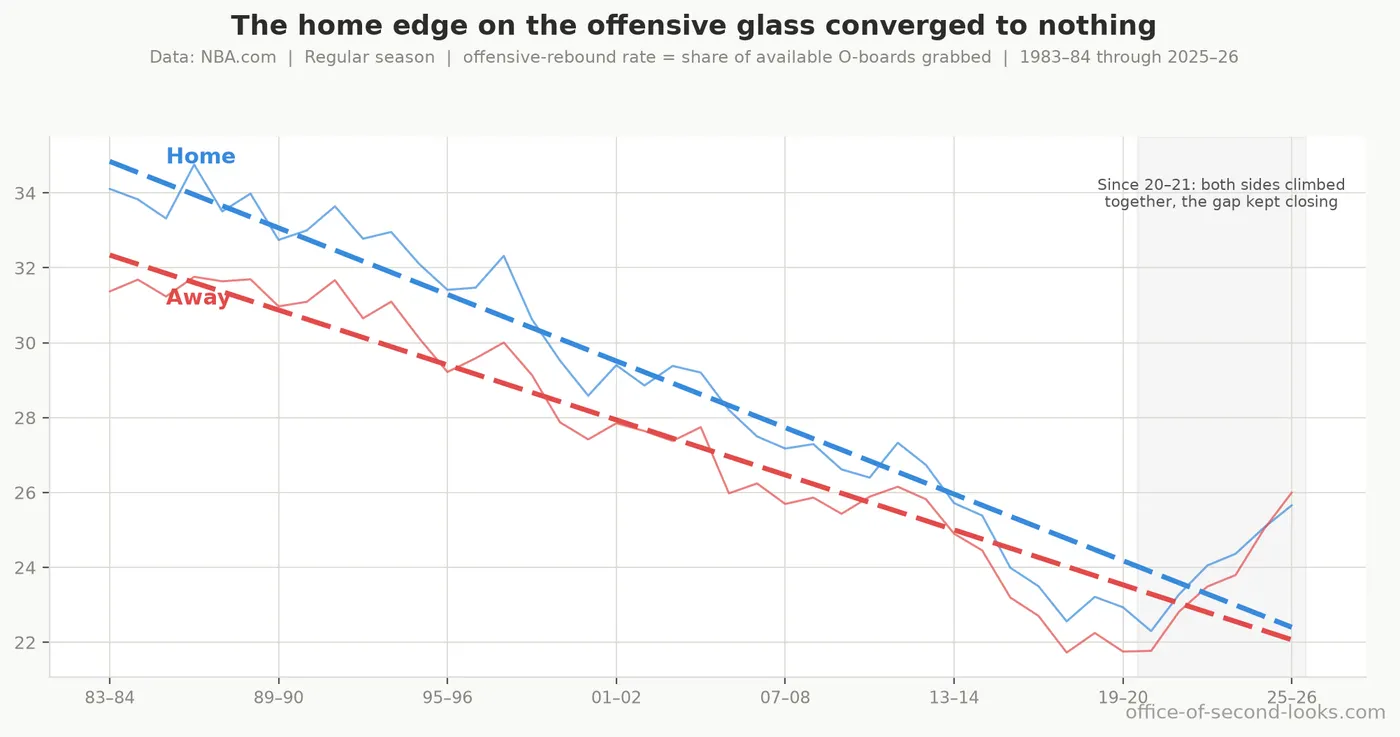
Home (blue) and away (red) offensive-rebound rate per season, the share of available offensive boards each side grabs. The two lines converge and cross: the home team’s edge on the…

The Mystery on the Glass

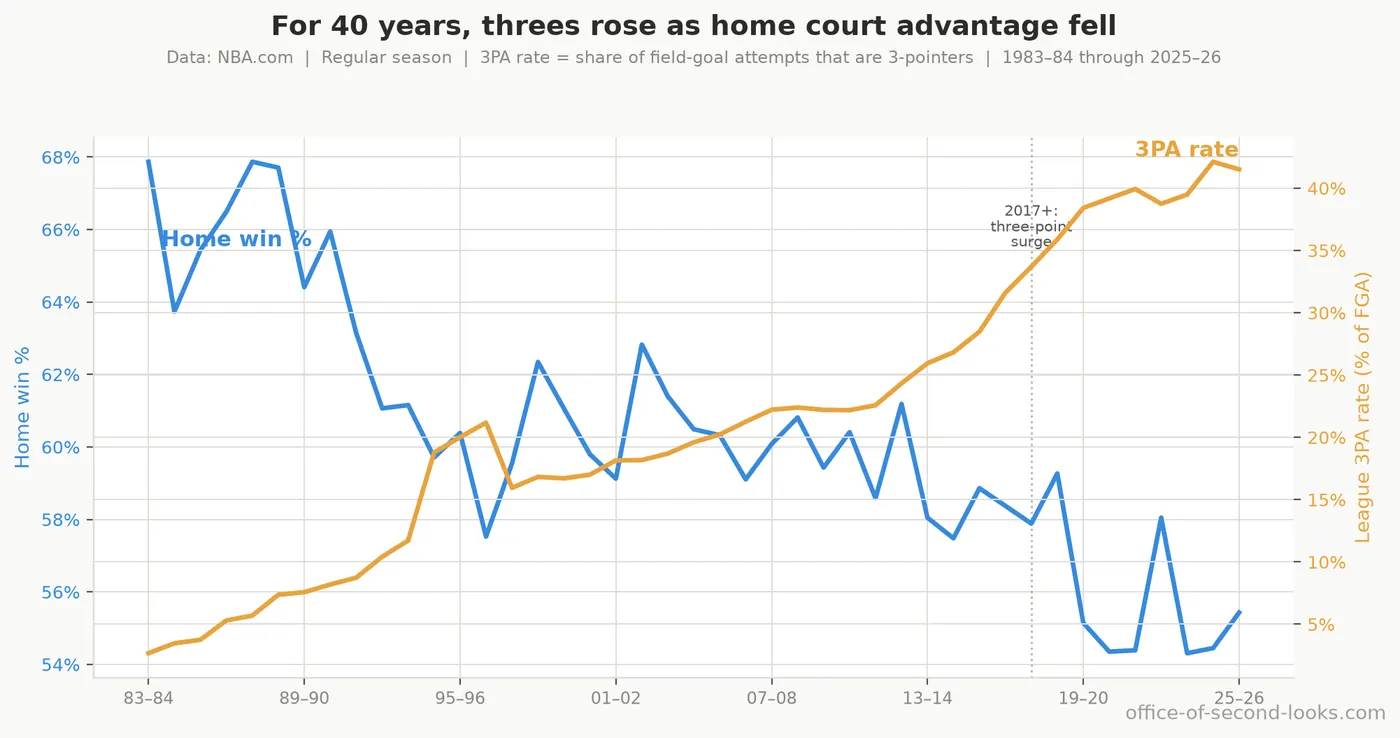
The league’s three-point attempt rate (orange, right axis) climbing as the regular-season home win rate (blue, left axis) falls, across four decades. The two lines are near mirror images…

The Three-Point Suspect

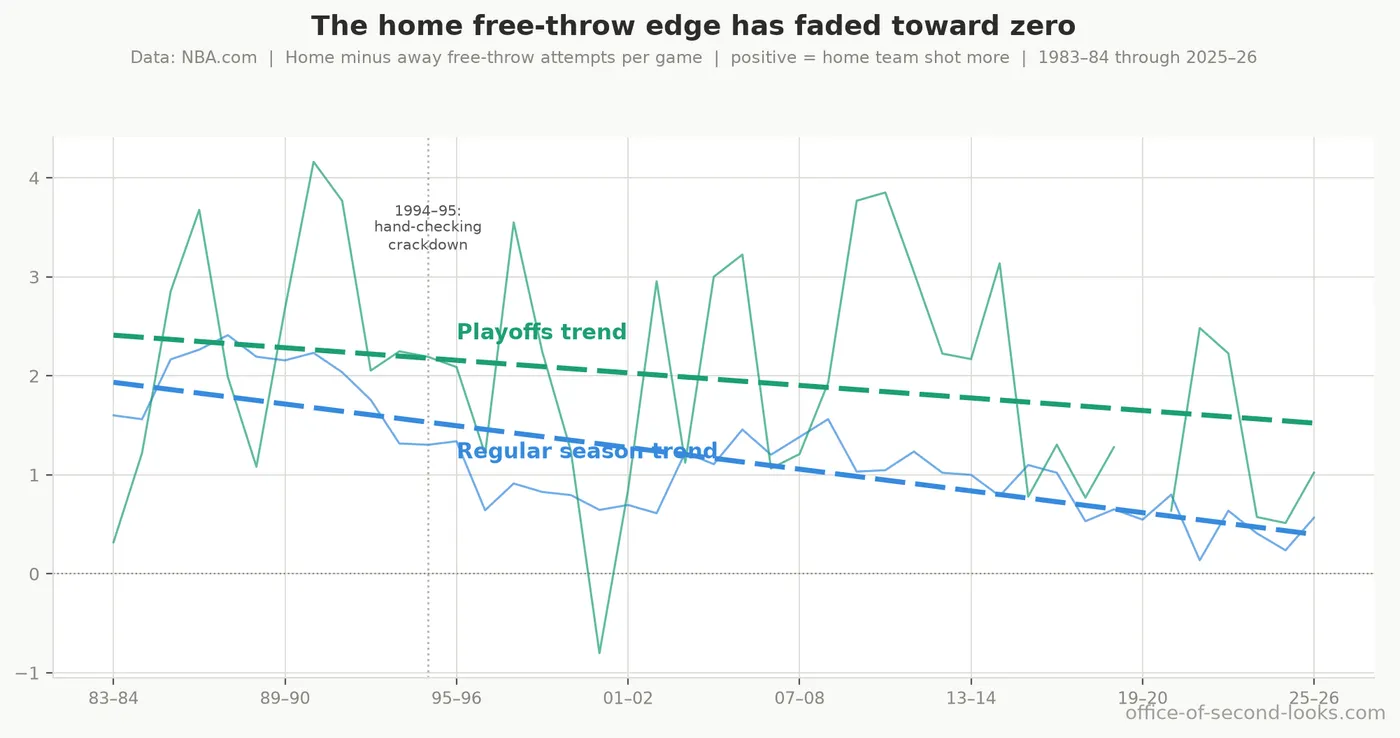
The home free-throw-attempt edge per season, home minus away: regular season (blue) and playoffs (green) both slide toward zero across 40 years, with the 1994–95 hand-checking crackdown…

The Whistle

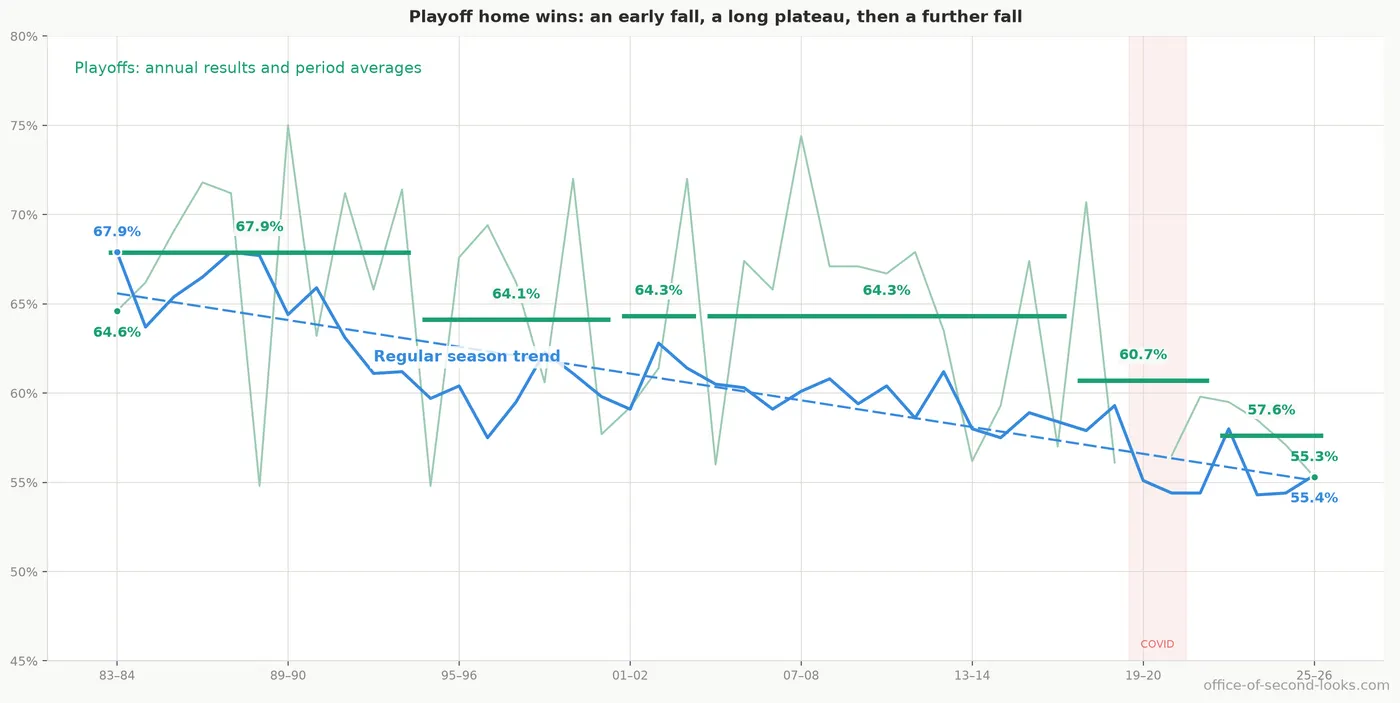
The home team’s win rate has fallen across four decades, in both the regular season and the playoffs, and never climbed back. Per-season home win %, 1983–84 through 2025–26; the regular…

Home Court Advantage Is Fading