
Part 5 of a series on the NBA’s fading home court advantage; start with Home Court Advantage Is Fading.
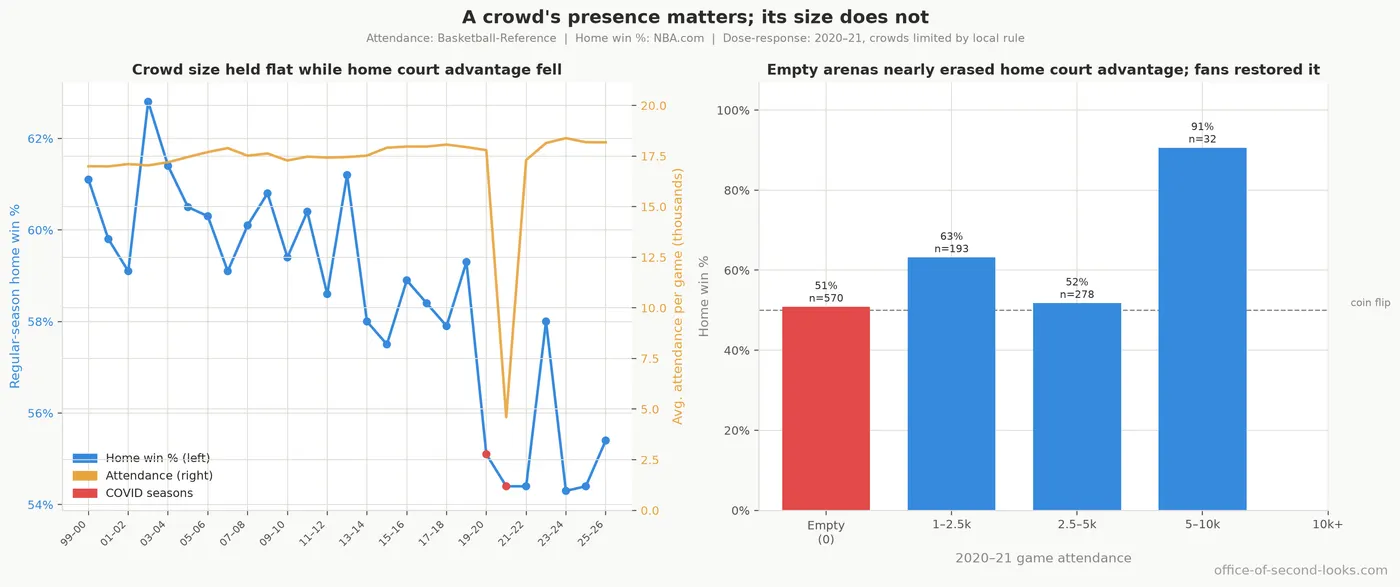
In the 2020–21 regular season the NBA played much of its schedule to empty buildings, and in the games with nobody in the stands home court advantage nearly vanished: home teams won just 50.9% of them, a hair above a coin flip. In games with any fans present, home teams won about 58.6%. So the crowd is a plausible reason for home court advantage: those two regular-season groups differ by about 7.8 points of home win rate, though which games had fans wasn’t randomly assigned, so this is a suggestive natural comparison rather than a controlled one. If crowds are what make home court advantage, and it has been fading for four decades, then crowds should have been thinning for four decades. They weren’t. Outside the pandemic season, crowds stayed within about a tenth of record levels in every season with attendance figures, and were among the fullest in the recent seasons when home court advantage was at its lowest. In 2020–21, among games with fans, the data detect no further link between crowd size and home wins. The 40-year decline has a list of possible explanations: rule changes, easier travel, load management, smaller crowds, faster pace, the 2014 playoff format. Each explanation has to account for a decline lasting decades, not just an advantage on a given night. Here they are, one at a time, with the crowd first because the pandemic provided an unusual within-season comparison.
The alibis at a glance
| Suspect | What the record says |
|---|---|
| Smaller crowds | Arenas stayed nearly full as the home edge fell |
| Easier travel | Its measured effect is tiny and points the wrong way |
| Time zones | No effect detected in either season type |
| Fewer tired visitors | Fewer back-to-backs account for about 8% of the decline |
| Pace and more even teams | Neither tracks the long decline |
| Rule changes | A temporary dip appears, but its cause cannot be isolated |
| The 2014 playoff format | No detectable step beyond the long decline |
Rule changes and a temporary dip
The 1994–95 hand-checking crackdown and the shorter three-point line arrived together. They are natural suspects for a change in the trend, but the timing alone cannot tell them apart. Most later rule changes left no clear mark. One possible exception is a mid-1990s dip, followed by a rise in the early 2000s. The hand-checking crackdown and the shorter three-point line began together, so this comparison cannot name a culprit. Foul calls shifted then too, a clue about officiating but no proof that hand-checking caused the dip. The same comparison finds no clear shift around the 2004–05 perimeter hand-check ban, the 2017–18 freedom-of-movement emphasis, or the 2022–23 take-foul rule. And in the playoffs, even 1994–95 doesn’t register. No single postseason stands out as the break point; the yearly playoff record is too thin to place one.
Travel, time zones, rest, and the schedule
Does the road itself wear visitors down? Barely: travel distance is worth about 0.07 percentage points of home win rate per 100 miles in the regular season, and if anything it leans slightly against the home team; in the playoffs there is no measurable effect at all. Time zones on their own show no effect in either. The obvious modern theory, that charter planes and better hotels have taken the sting out of the road, misses an important point: the home team travels too. It flew back from its own road trip, so a smoother, more comfortable league plausibly helps both sides, and the travel effect measured above is tiny anyway. Neither travel distance nor time zones explain the long decline in home court advantage.
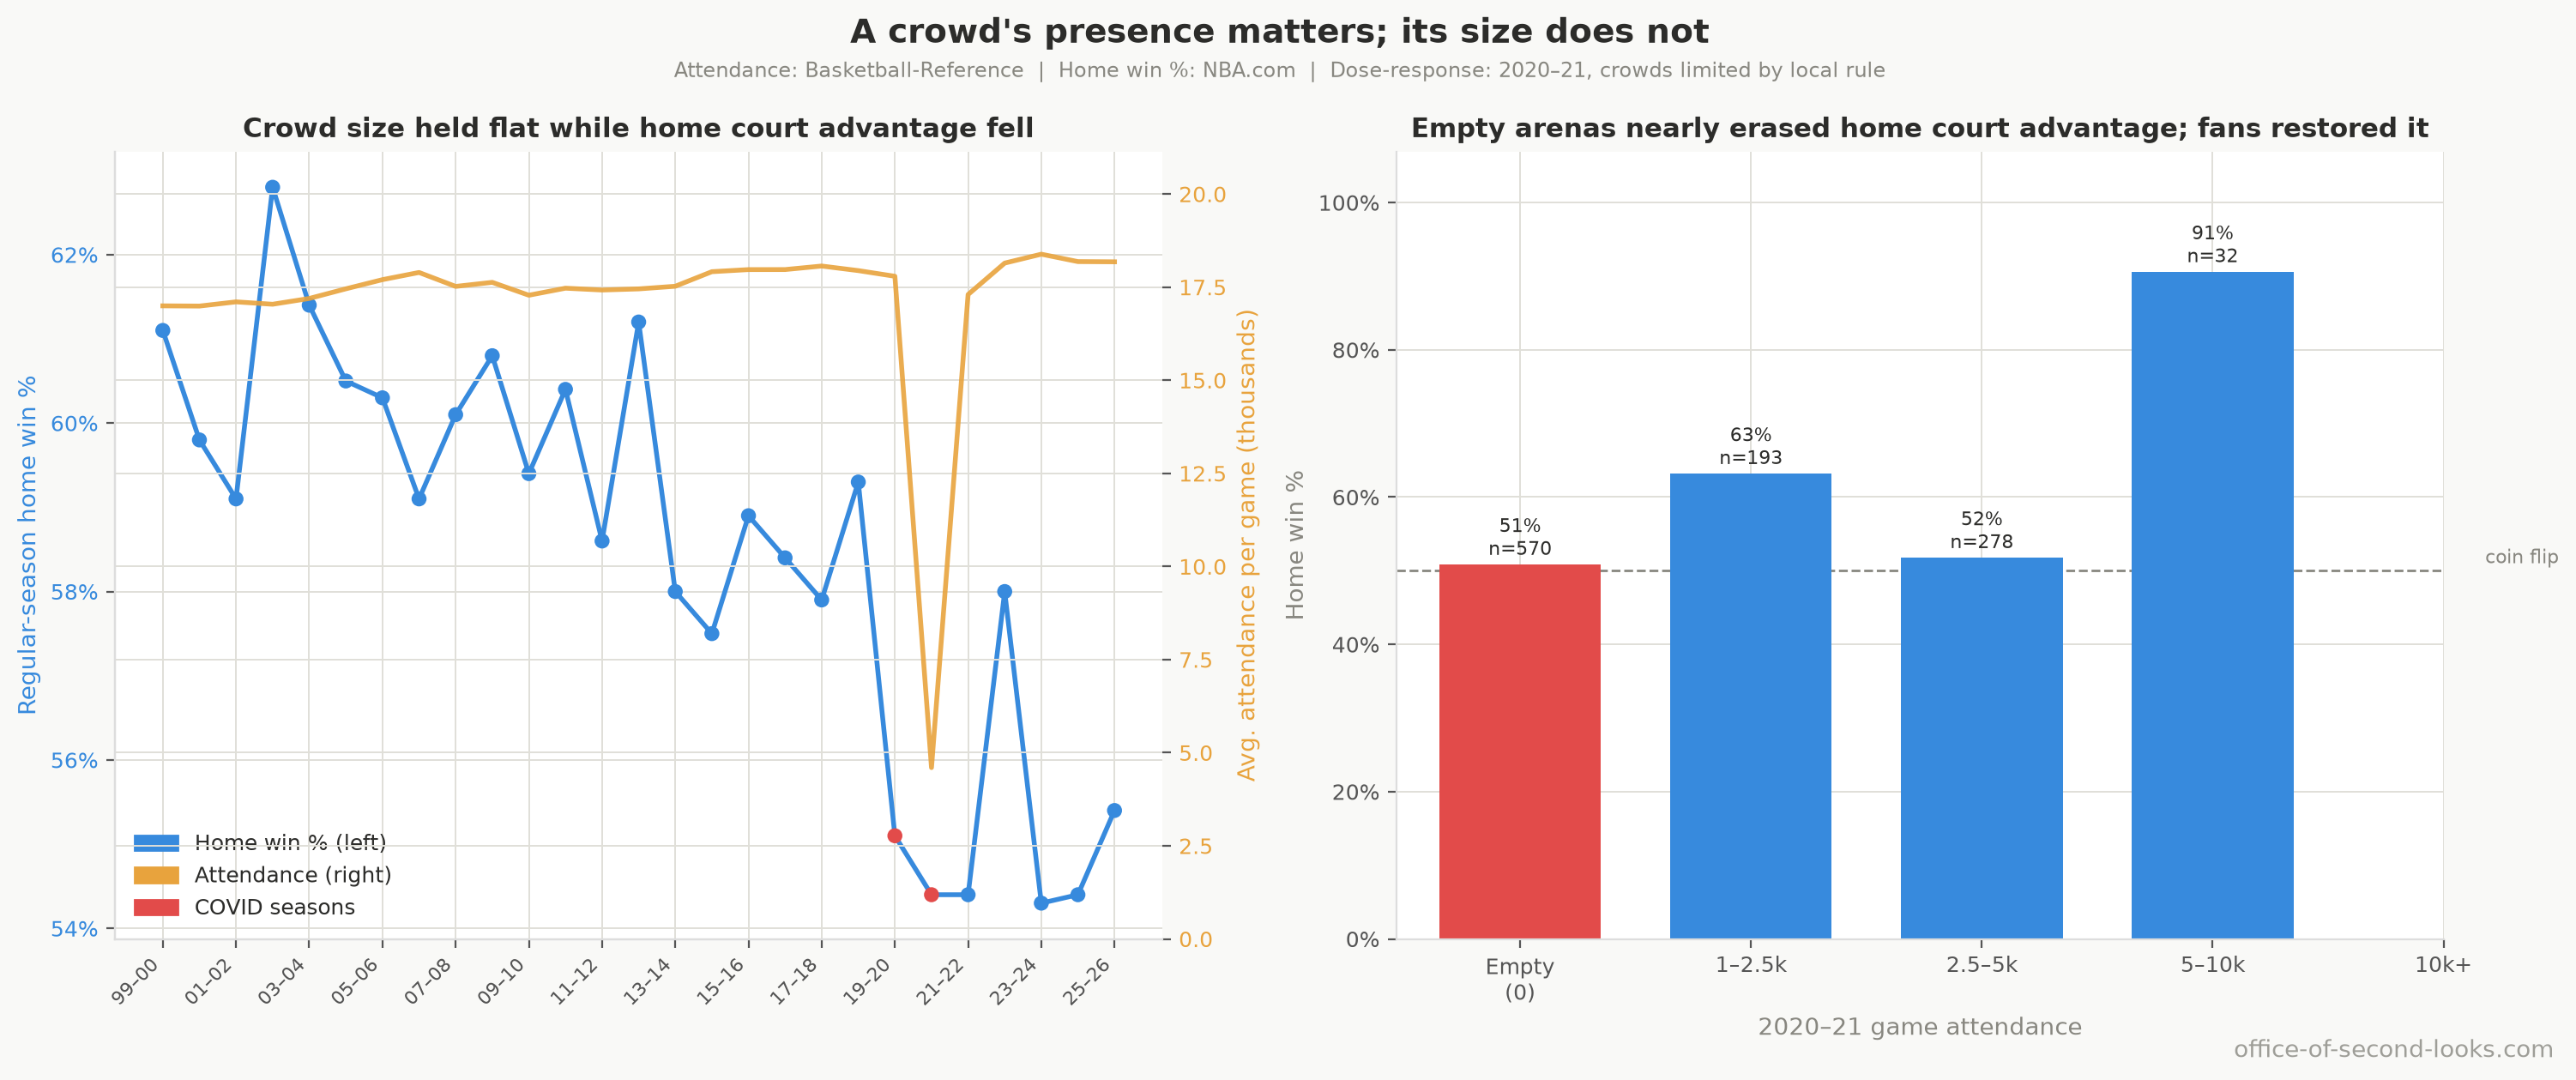
Rest is another suspect: it matters on a given night, but the rest advantage has not shrunk along with the home edge. In the regular season, home teams win 63% when they are the better-rested side and 58% when the visitor holds the rest advantage, a real swing. The data detect no change in that gap over the decades; if anything, it has grown. Visitor back-to-backs did become less common, falling from 35% to under 20%, so fewer tired visitors could account for some of the decline. They account for about 8% of it: home teams also win less than they used to when visitors are rested.
📊 Visitor back-to-backs became less common, but that schedule shift accounts for only about…
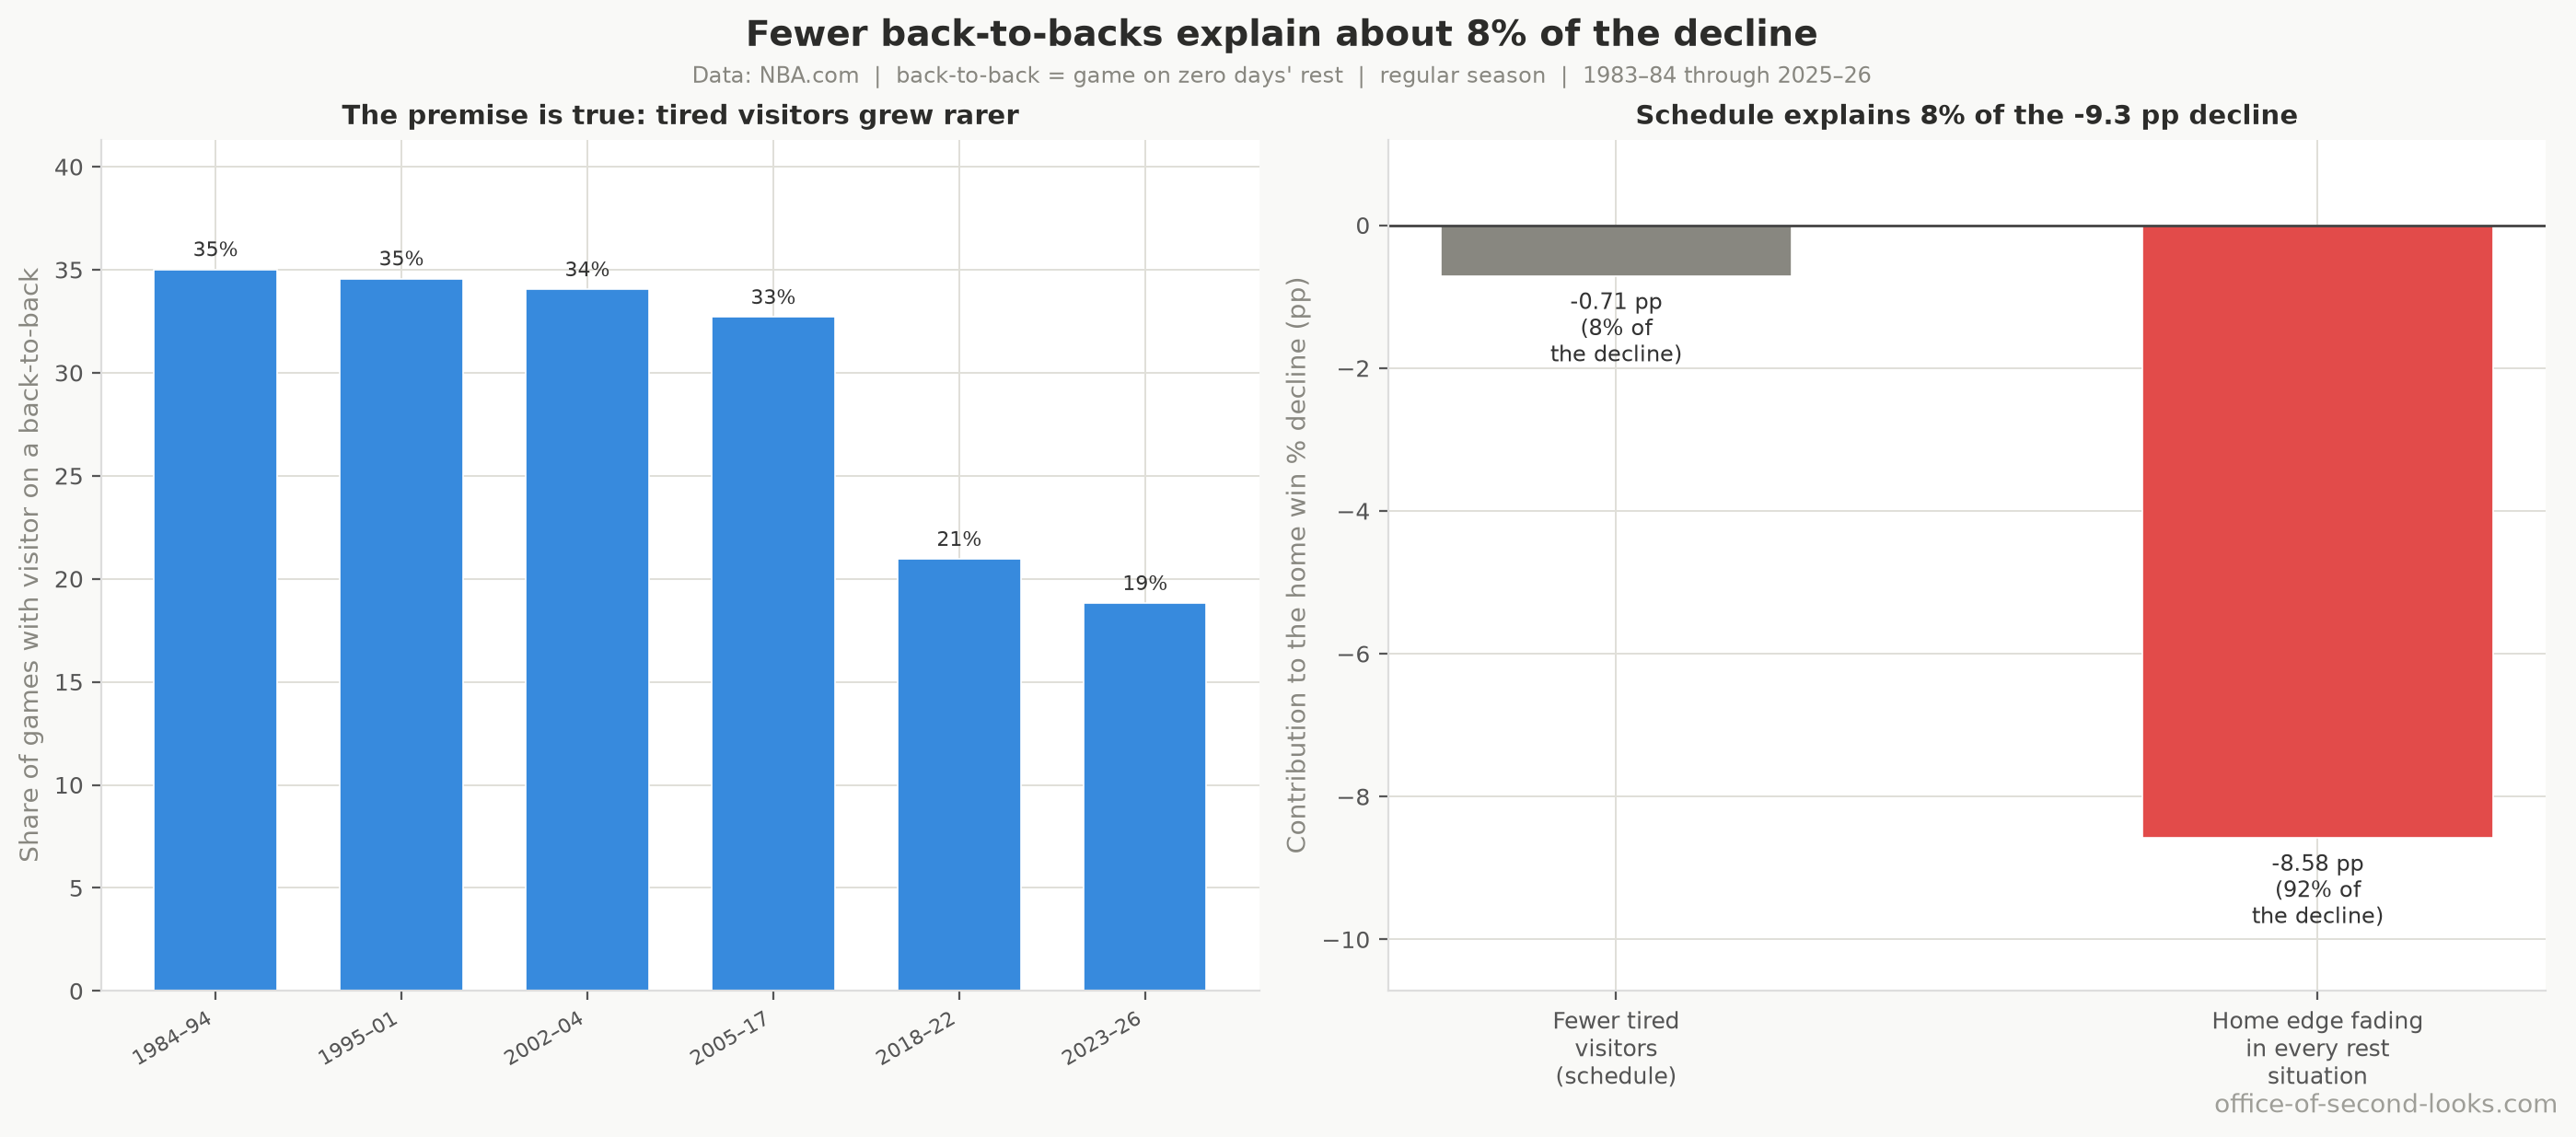
In the playoffs, only series openers can give the teams different rest. In a simple comparison of those games, each extra day of rest relative to the opponent goes with about 1.5 percentage points more home wins. But a team that finished its previous series quickly may also be the stronger team. Compare teams of similar strength, and the evidence that rest itself helps is inconclusive.
📊 Home win rate by which team was better rested. The playoff bars use series openers only…
Faster games have a slightly higher home win rate, but game pace can reflect what happened on the court: a blowout might produce more possessions in garbage time. When games are compared using the pace expected before tip-off, the apparent link weakens and is too uncertain to call. Season by season, changes in pace do not track the decline in home court advantage. A related theory says visitors adopted the three-pointer faster than their hosts and eroded the home edge that way. If anything the opposite happened: the home-vs-away gap in three-point attempts has grown, with home teams now taking slightly more threes than visitors in the regular season.
Competitive balance is the subtle one. The raw season-to-season comparison shows nothing. A faint link appears only in the year-to-year ups and downs, and it runs the opposite way to the usual hunch: in a season when teams are more evenly matched, the advantage edges up a little rather than down, and even that rests on a small sample. That’s suggestive at best, not proof of anything, and parity has risen and fallen for 40 years while home court advantage fell across the whole span, so it can’t account for the long decline.
Crowd size was already cleared in the opening, so that leaves one more check: throw every off-court suspect in together at once. Put rest, altitude, time zones and the COVID seasons into one model, and rest and altitude matter on a given night, but none of them explains the long-run decline. Those off-court conditions together account for only about half of what the model explains; the other half belongs to when the game was played, which is the decline itself, not any off-court condition. The full treatment of each hypothesis, why it seemed plausible and exactly what the data showed, is in Part 2 of The Investigation.
No single franchise to blame
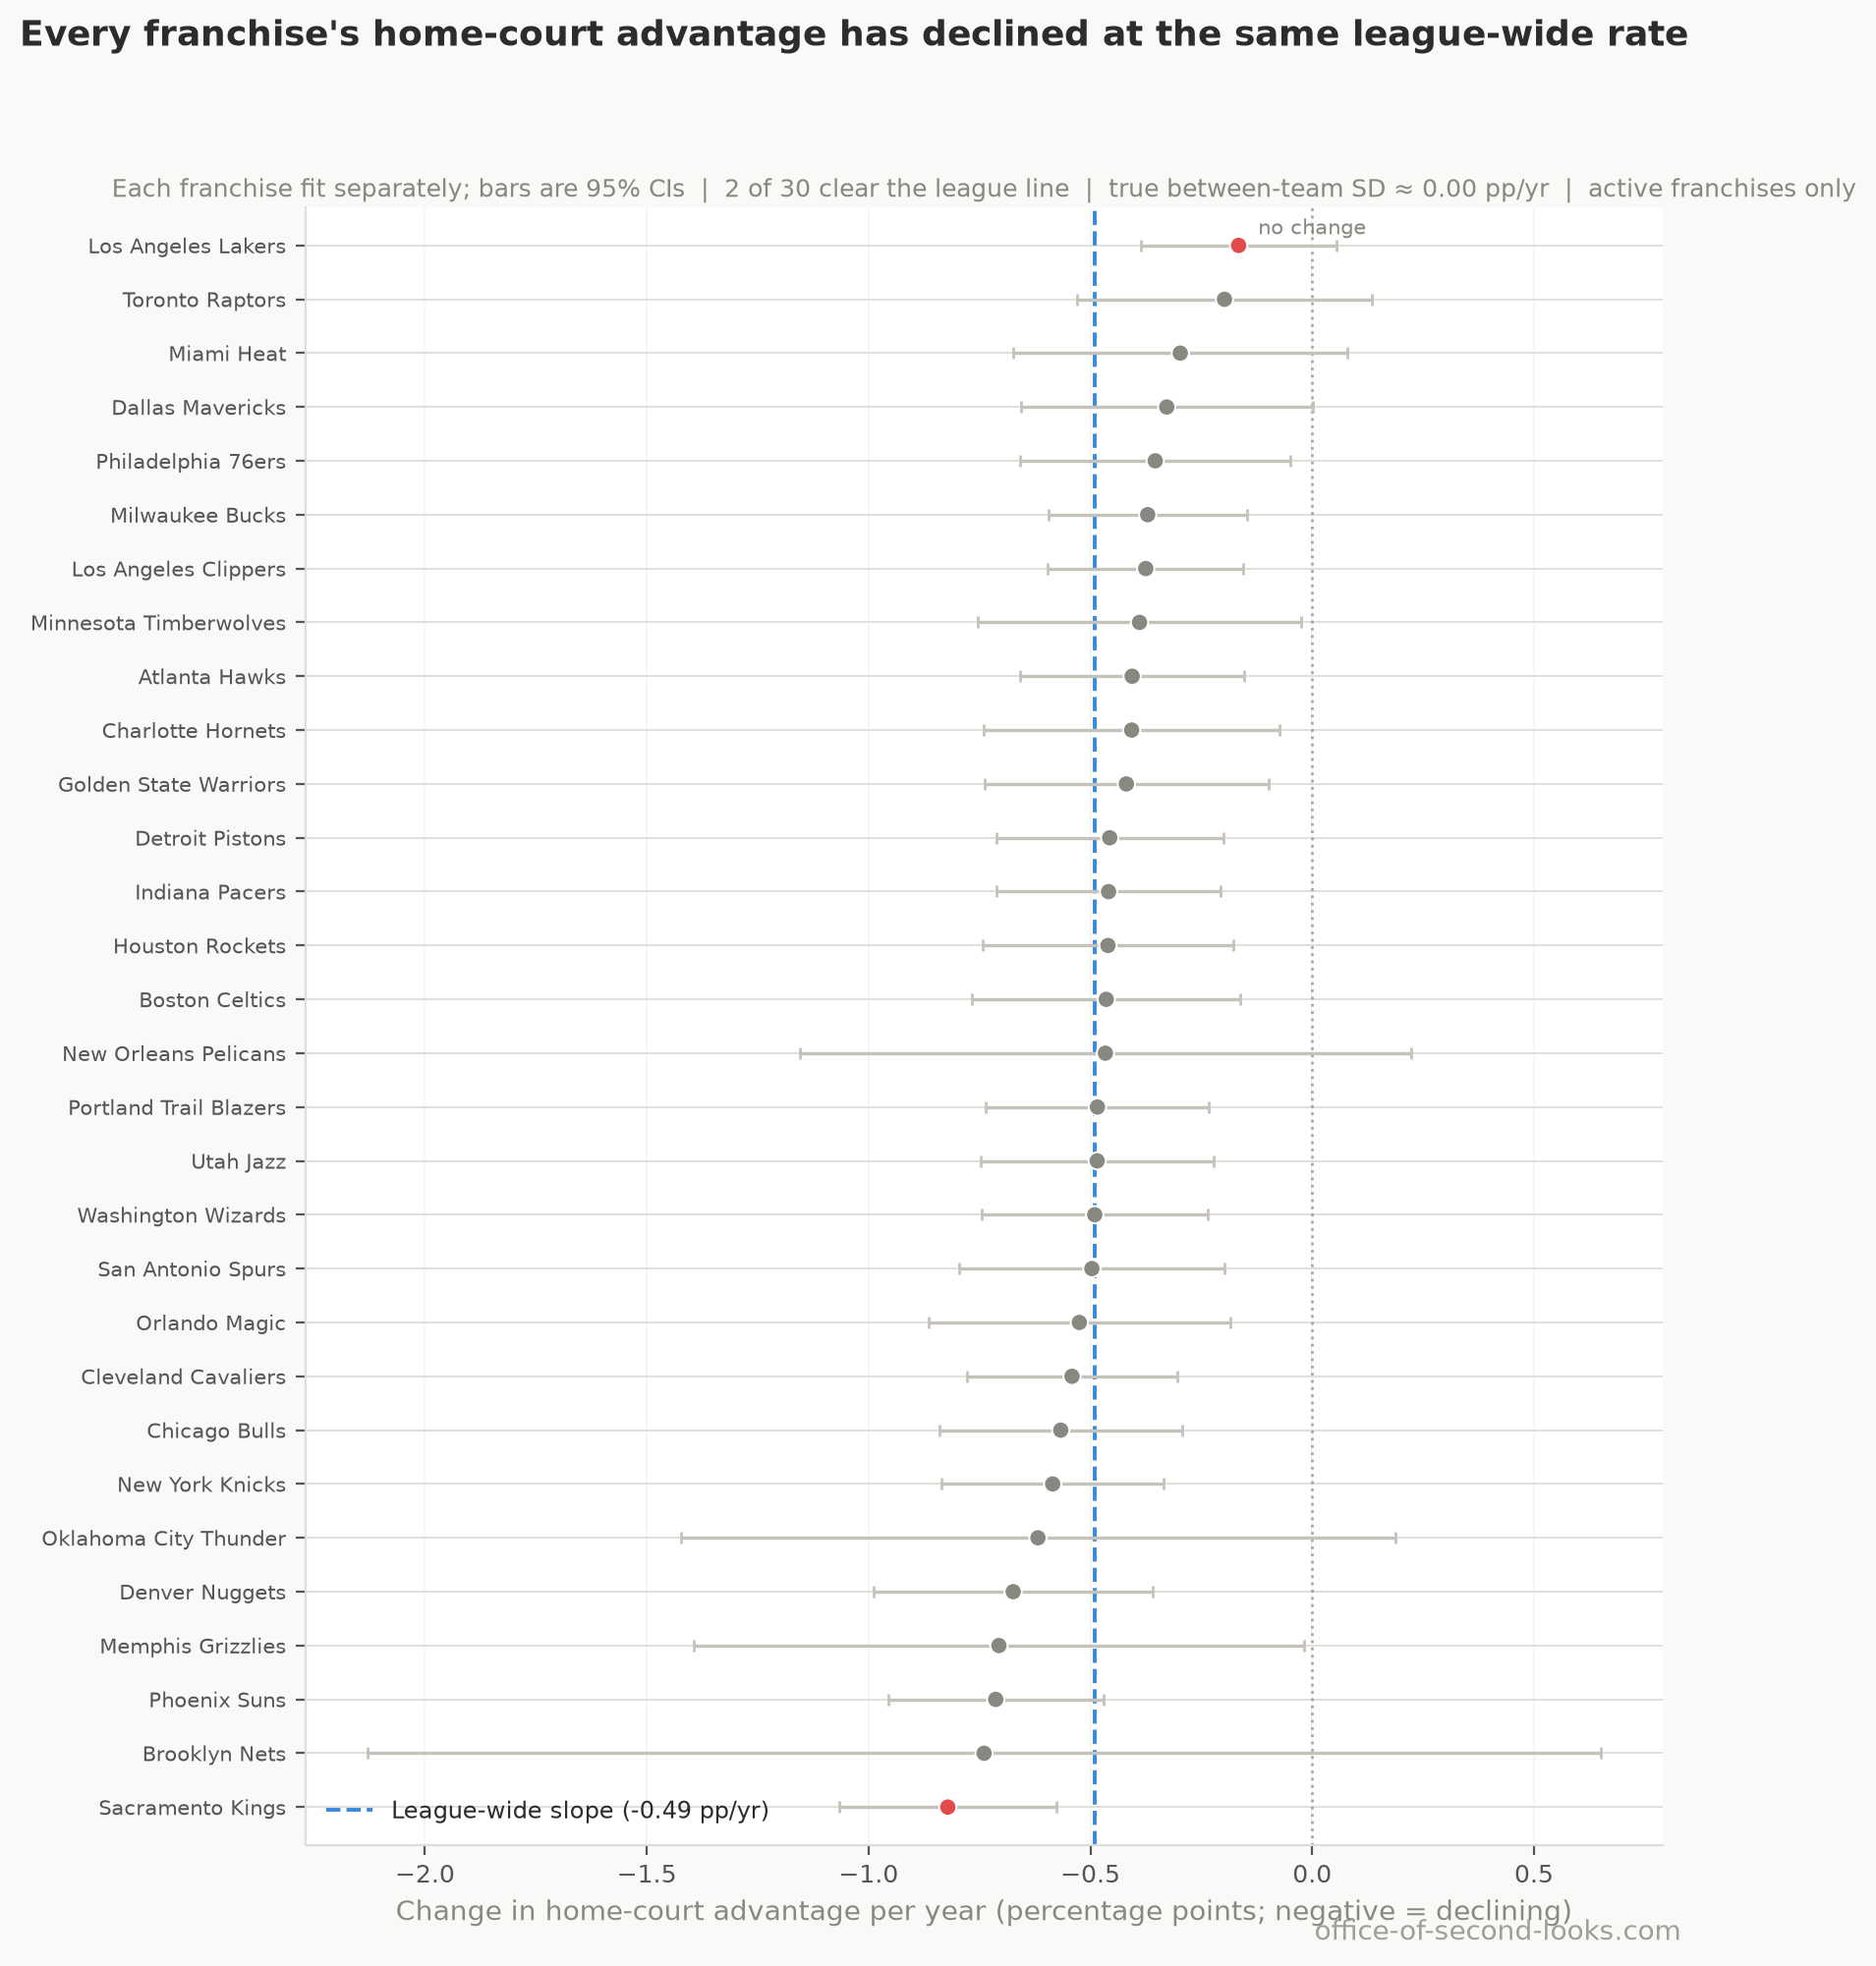
Maybe a few teams dragged the average down. They didn’t. Each active franchise was tracked separately, and once you remove the random bounce of a 40-odd-game home schedule, the spread across teams is no bigger than that randomness: any real team-to-team difference in decline rates is too small to detect. Taken together, the franchises fit one league-wide rate of about half a point of the home-road gap per year. No single team stands apart as the cause. This is a regular-season result; per-team playoff samples are too small to split this way.
📊 How fast each franchise’s home-court advantage changed per year, with a bar showing the…
The 2014 playoff format change
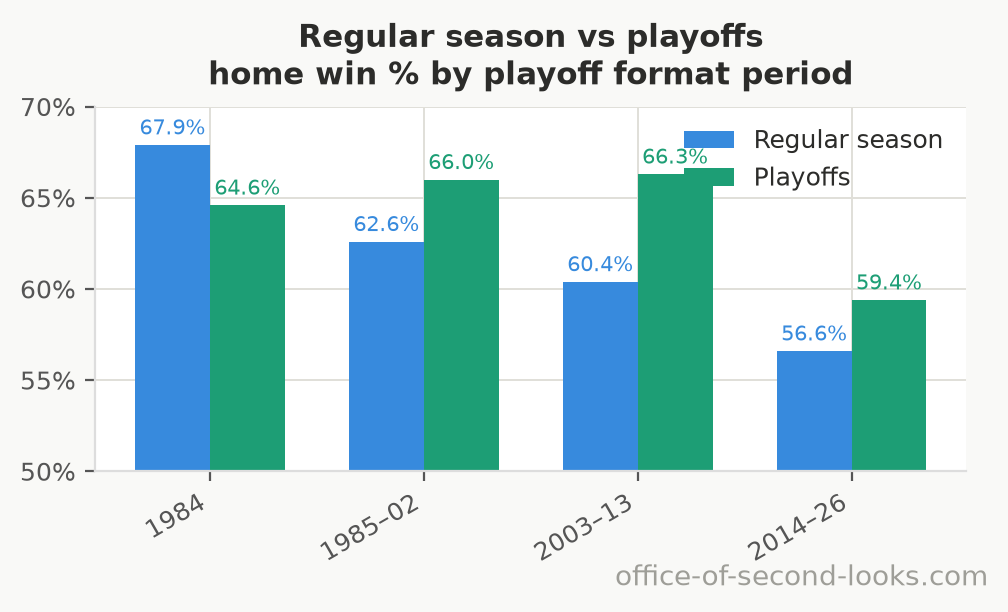
The periods on either side of the 2014 format change show a nearly 7-point drop in playoff home wins, from the 2003–13 average to the 2014–26 average. That is the largest drop between consecutive format periods, and the only transition where the average fell. It makes the format change worth testing, but those broad averages do not date the decline to 2014. It has one. Fit the playoffs’ own long-run decline and the format change adds no detectable step of its own: the post-2014 drop is consistent with that decline passing through. The clean tell is the regular season, which never changed format at all yet slid at -0.24 points of home win rate a year across the whole span against the playoffs’ -0.23. Those are averages across the full record, not evidence that the two declines followed the same timeline. So the format adds nothing the playoff sample can detect. An effect too small for the playoff sample to reveal is still possible, which is as far as a test like this can take you.
📊 Home win % averaged over each playoff format period, for both the regular season and the…
A whole lineup of suspects, and nearly every one has an alibi. The forces behind the 40-year decline show up in the box score: the rise in threes, the whistle, and the glass. In the playoffs the four factors (shooting, rebounding, turnovers, and fouls) account for less of the decline, closer to two thirds than to all of it, though on so few playoff games that share is loosely pinned.
Next: The Playoffs Are Different (and the Same). The postseason didn’t skip the decline; it arrived on its own timeline, and in its own shape.
Back to the series hub: The Disappearing Home-Court Advantage
Data: NBA.com Stats, pulled with the open-source nba_api tool; attendance records from Basketball-Reference.