
Part 1 of a series on the NBA’s fading home court advantage.
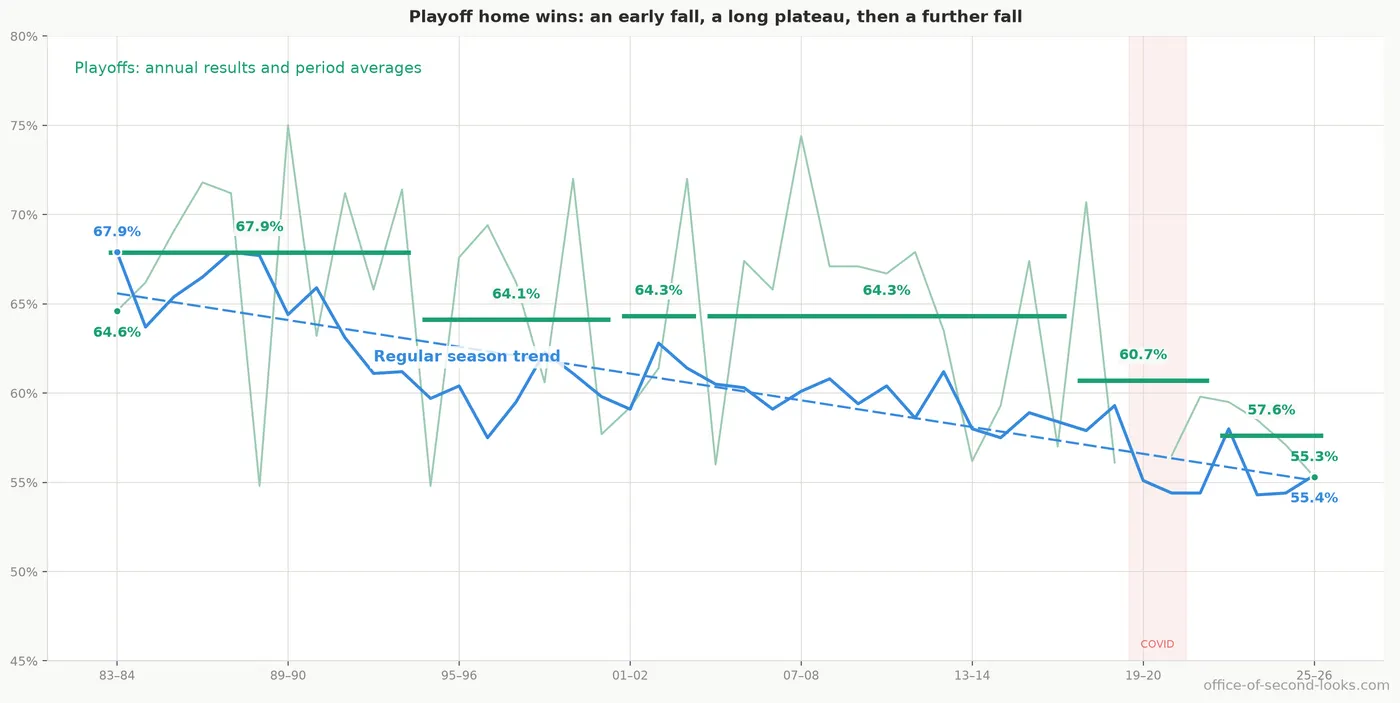
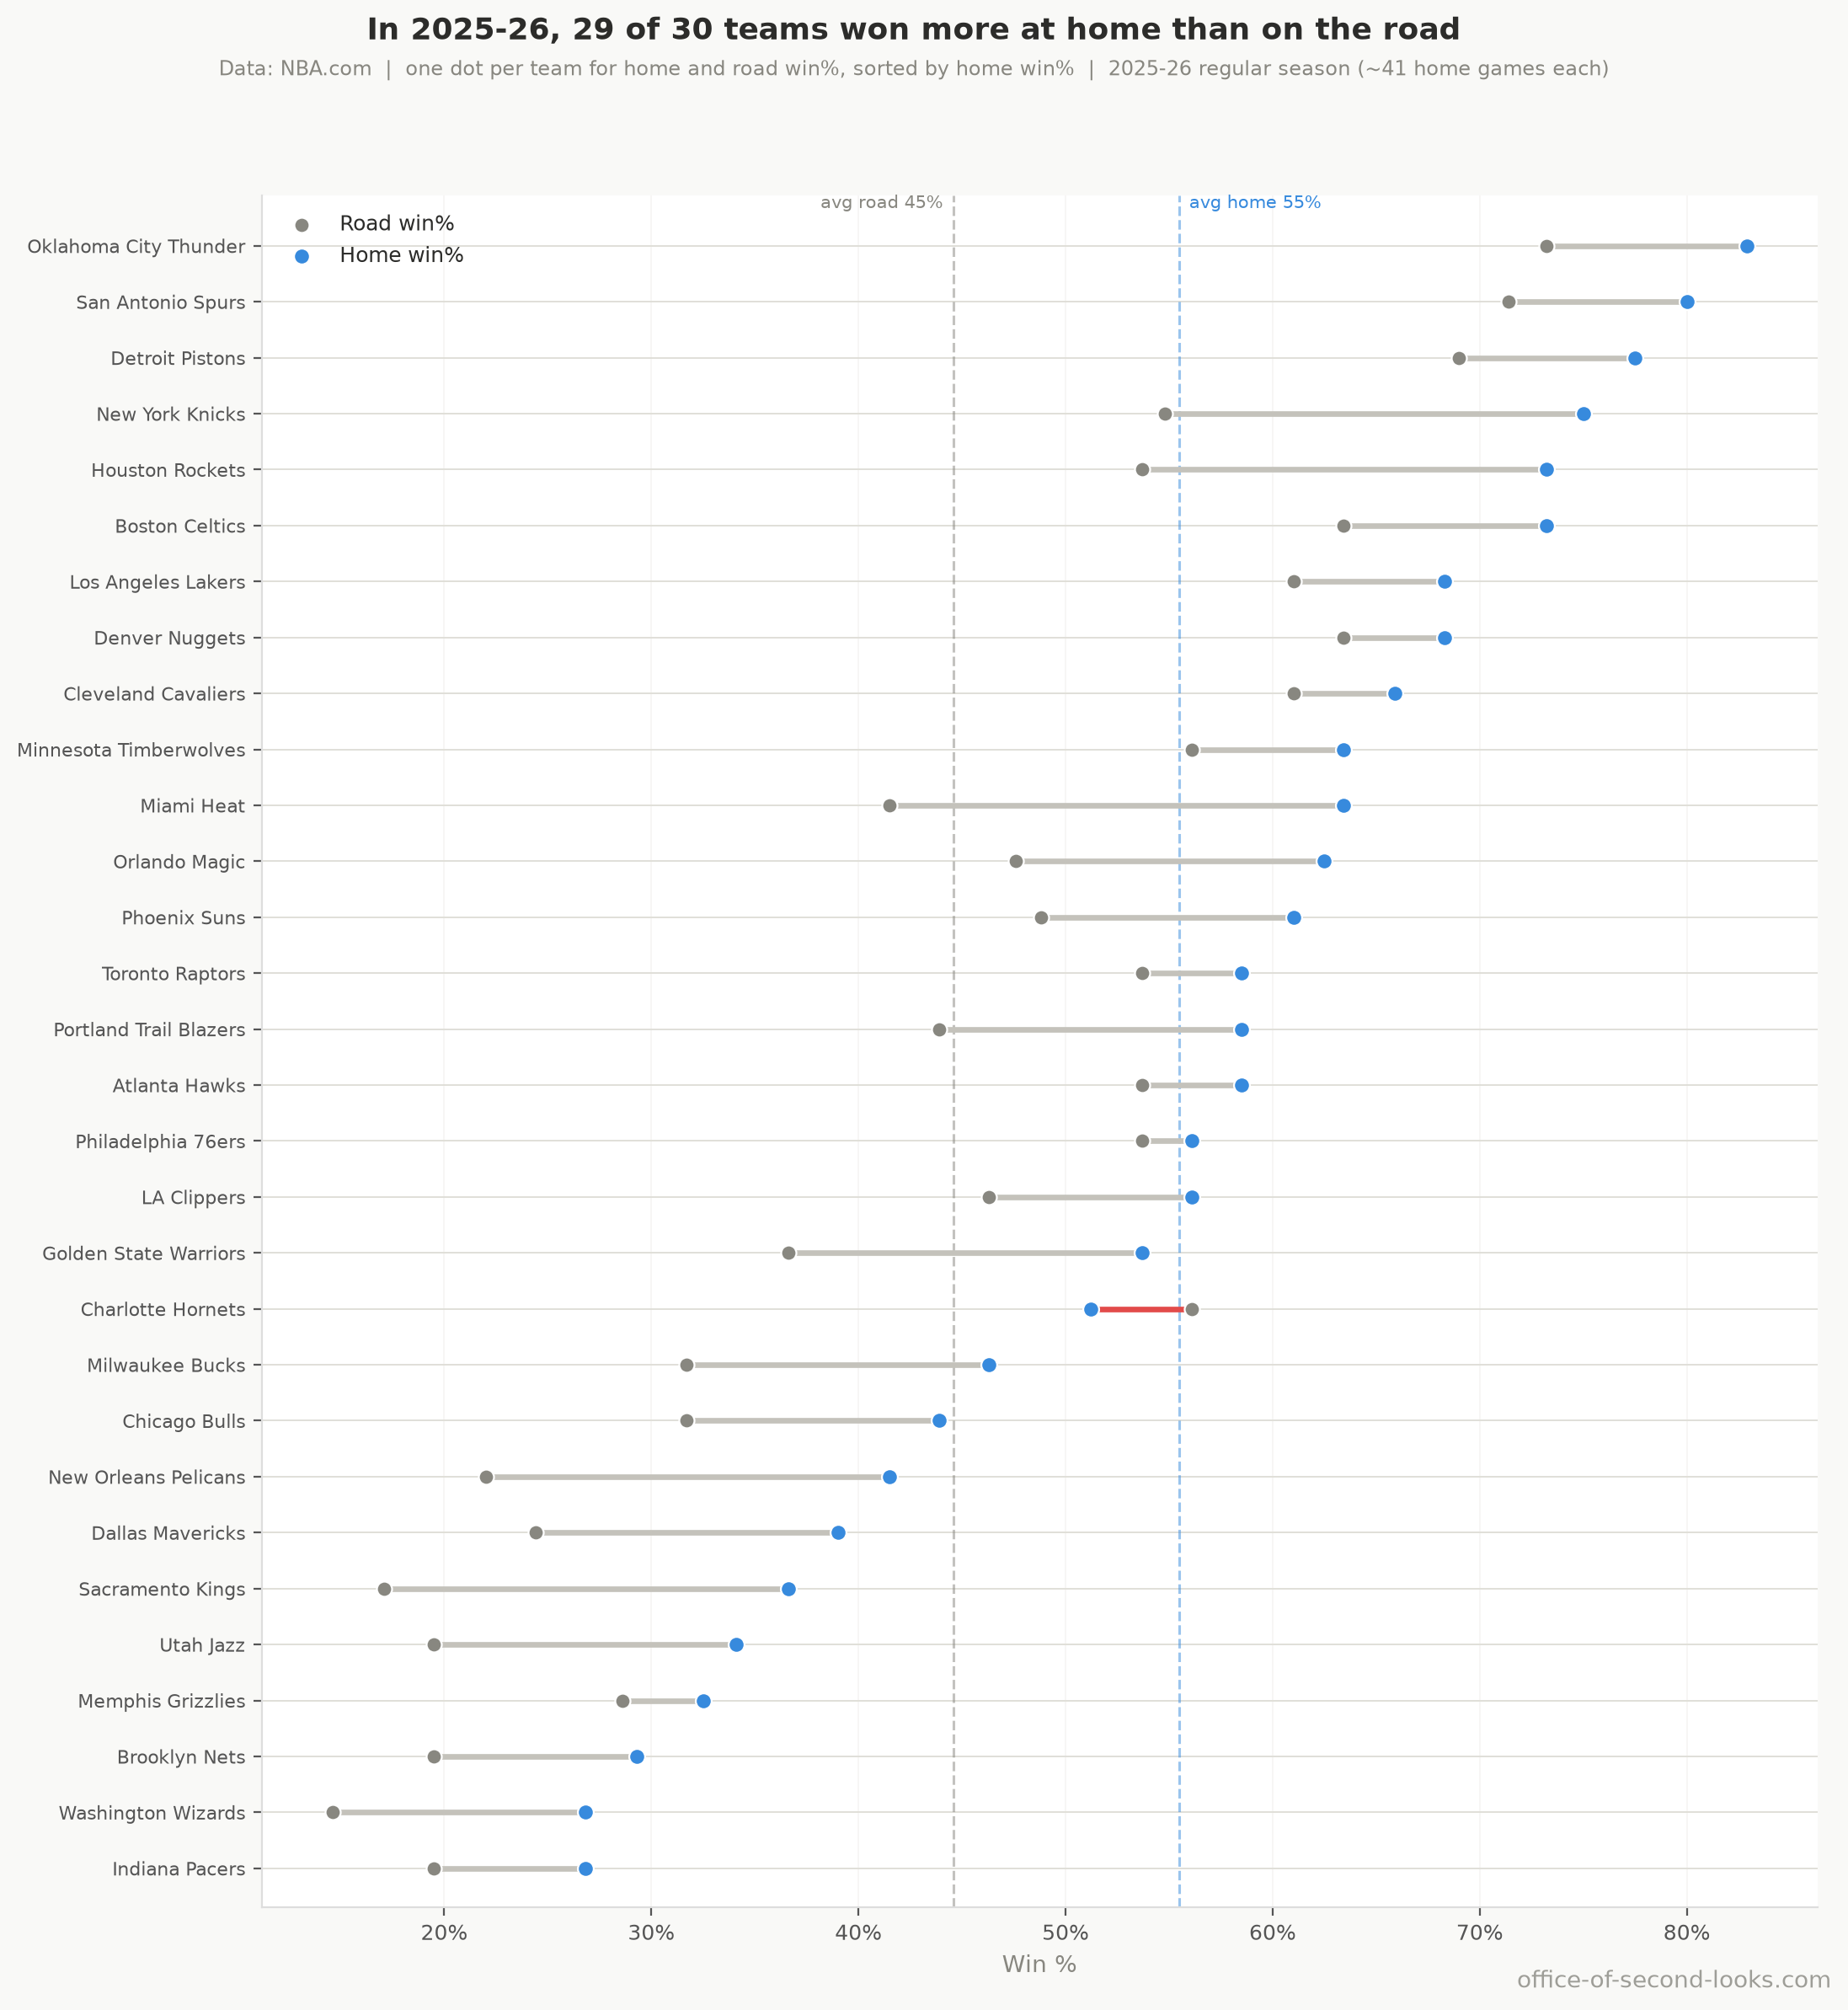
Home court isn’t dead. In the latest regular season, all but one team still won more at home than on the road. What has faded is the size of that edge. In the mid-1980s, the home team won about 65% of NBA regular-season games. Today it wins about 55%. In the playoffs the fall is the same size, from about 68% to 58%.

So this is a whodunit. Was it the three-point revolution? The referees? Easier travel, or better-rested visitors? Not a shrinking crowd: arenas are about as full as they have ever been, even in the recent seasons when home court advantage was at its lowest. The home team’s lost rebounding edge and part of its shrinking turnover edge are still mysteries.
The shape of the fall
The regular-season fall was steepest through the mid-1990s, then eased into a slower, steady drift with no rebound since. The latest leg lines up with the rise in threes: after 2017 the share of shots taken from deep rose from about a quarter to about 40%, and the home win rate slid alongside it.
The playoff home win rate averaged about 68% in 1984–94, then about 64% in each period from the mid-1990s through 2017. The later periods were lower again: about 61% in 2018–22 and 58% in 2023–26. These averages describe an earlier fall, a long middle plateau, and a further recent fall; the smaller postseason sample cannot reliably identify a turning year.
It is not the story of a few collapsing franchises: every active team’s home edge slipped, and no team’s rate of decline can be told apart from the league-wide rate of about half a point a year. Sacramento’s and Phoenix’s home edges fell the most; Denver’s and Utah’s fell too but are still the biggest in the league. Weak teams still pick up most of their wins at home, while the best teams win nearly as often on the road.
The favorite-versus-underdog comparison asks a narrower question. The gap between their home win rates narrowed only in the last four postseasons, mostly because favorites won less often at home. Across the full record, the playoff decline persists when the teams’ quality gap is removed. The Playoffs Are Different (and the Same) examines the playoff timeline and the favorite-versus-underdog comparison.
📊 Each team’s home win% (blue) and road win% (grey) for the most recent regular season,…
What home court advantage is actually made of
Before the case can turn to suspects, it helps to know what is being stolen. The box score breaks a possession down into the four factors: shooting, rebounding, turnovers, and fouls, with foul calls standing in for free throws. Home teams have historically come out ahead on all four: they shoot a little better, grab more rebounds, commit fewer turnovers, and get the friendlier whistle. Together the four account for about 95% of the home advantage, with shooting the biggest share. So the question is which of the four shrank, and why. Here is each factor’s share of the advantage, and of its decline:
| Factor | Share of the advantage | Share of the decline |
|---|---|---|
| Shooting (eFG%) | 43% | 21% |
| Rebounding | 25% | 30% |
| Foul calls | 14% | 18% |
| Turnover margin | 13% | 27% |
| All four together | 95% | 96% |
These are regular-season shares. Both columns shift a bit depending on which games are counted, and rebounding’s lead over turnovers is narrow. The playoffs point the same way on far fewer games, but there the four factors account for only about 67% of the decline.
Where it is heading
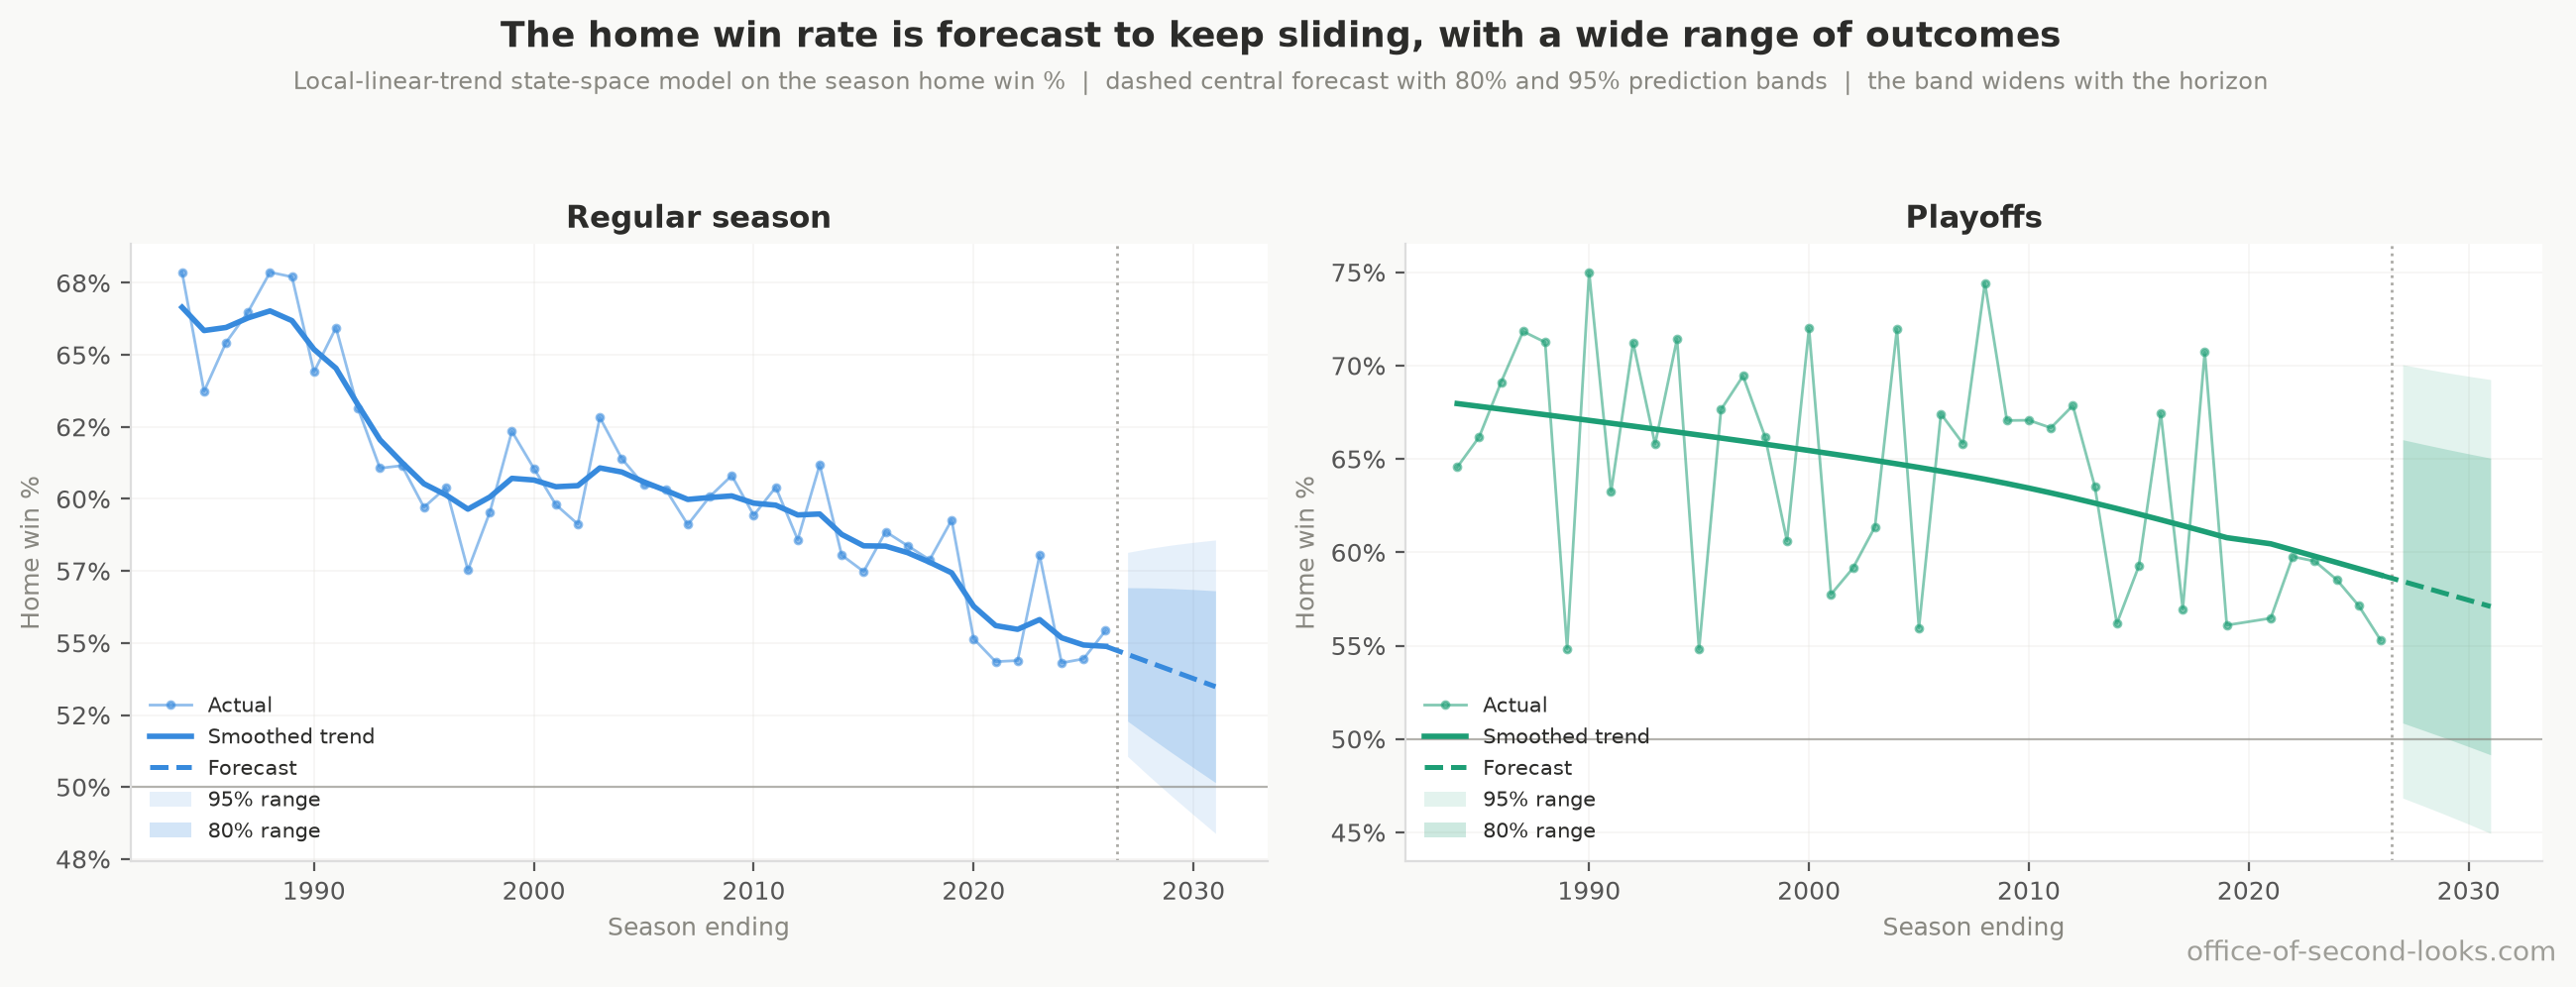
Extend the recent trend and it keeps sliding, slowly, toward about 53.5% by 2031. That prediction is just by drawing a line; I don’t know anything about future rules changes or anything else that would power this. The empty arenas of 2020–21, at 51%, hint at where a floor might sit, though one disrupted season can’t settle that.
📊 Season-by-season home win %, its smoothed trend, and a forecast for the next five…
The docket
The rest of the series works the case suspect by suspect. The four factors show where home teams lost their edge. The rise in threes is a change in how teams play that cuts across several factors, so its share of the decline is counted differently from any single factor’s share.
- The whistle. Referees once favored the home team and gave it the extra trips to the line; that gap has mostly closed, and part of the reason is a fairer game. The Whistle takes on the foul calls.
- The rise in threes. As shots moved to the arc, the home shooting edge shrank, and the change shows up in fouls and turnovers too; in all, it accounts for close to half the decline. The Three-Point Suspect asks how much it really explains.
- The glass and turnovers. Home teams lost most of their old rebounding edge, and the data do not tell us why. Visiting teams also closed part of the turnover gap for reasons the rise in threes does not explain. The Glass and the Turnover Gap opens both questions.
- The usual suspects. Travel, time zones, pace of play, crowd size, almost every rule change, and the 2014 playoff format switch: each turns out to have an alibi. The Usual Suspects rules them out one by one.
- The playoffs. The playoff edge fell too, on its own timeline. A best-of-seven series shrinks the edge to about a third of its per-game size, and shrinks the drop by the same proportion. The Playoffs Are Different (and the Same) covers it.
- The buildings. A few arenas still carry the biggest home edges, with Denver and Utah at the top, likely because of altitude. The Altitude Exception visits them.
- The proof. Every claim here was run through checks built to make it fail. How I Know This Isn’t Made Up shows the work.
Home court used to be the reward for a strong 82-game season. Now the advantage is fading, for reasons that are only partly known, and the rest of this series takes those reasons apart.
Next: The Whistle. Nearly every referee with a long playoff record called fewer fouls on the home team; the next article shows how that tendency changed over time.
Back to the series hub: The Disappearing Home-Court Advantage
Data: NBA.com Stats, pulled with the open-source nba_api tool; attendance records from Basketball-Reference.