
Part 2 of a series on the NBA’s fading home court advantage; start with Home Court Advantage Is Fading.
For as long as the records go back, the home team in the NBA has gotten the friendlier whistle. Of the 47 officials with at least 50 playoff games on record, 45 called fewer fouls on the home team. Then the friendly whistle mostly faded, more in the regular season than the playoffs. The home foul advantage in the regular season fell from about 1.2 fouls a game in the 1980s and early 1990s to roughly a quarter of a foul today, an 80% reduction; in the playoffs it dropped from about 1.6 to 0.7. Here is how it worked, why it faded, and how much it mattered for winning.
The whistle always favored the home team
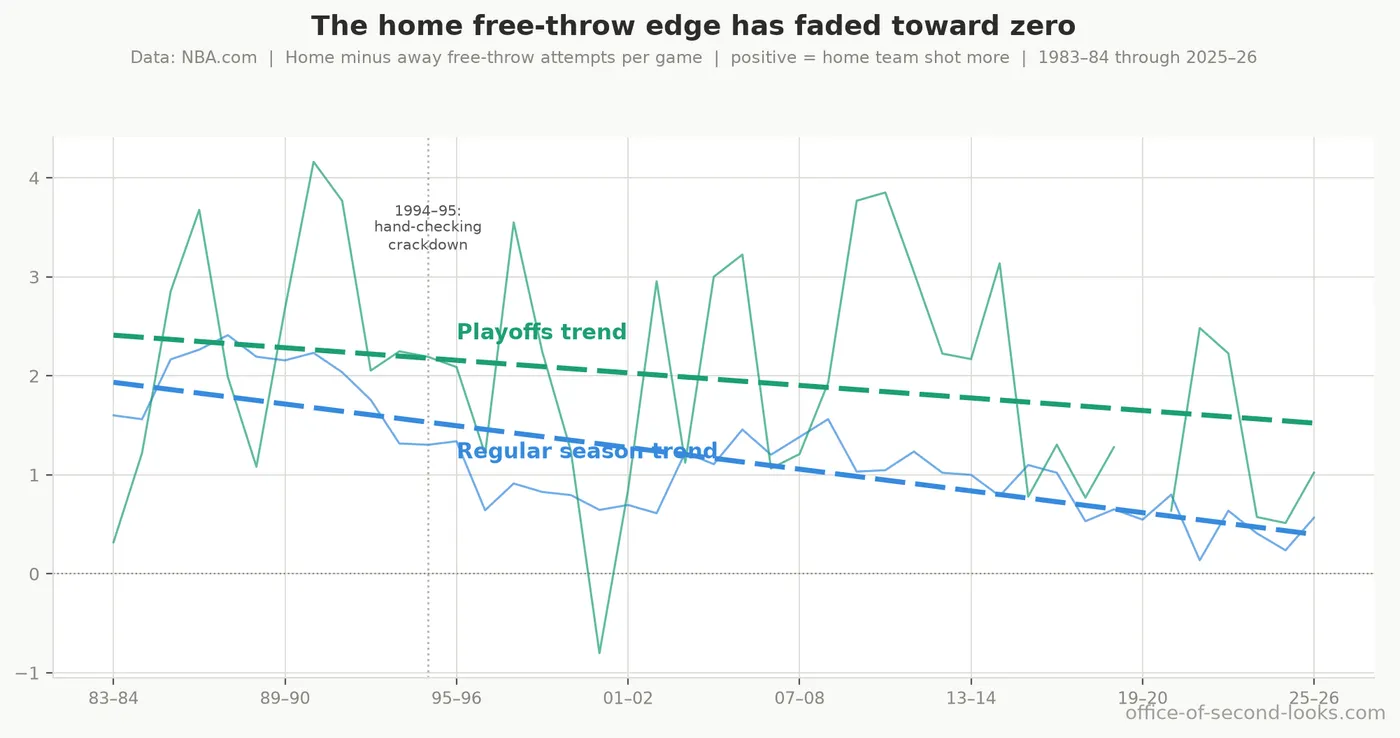
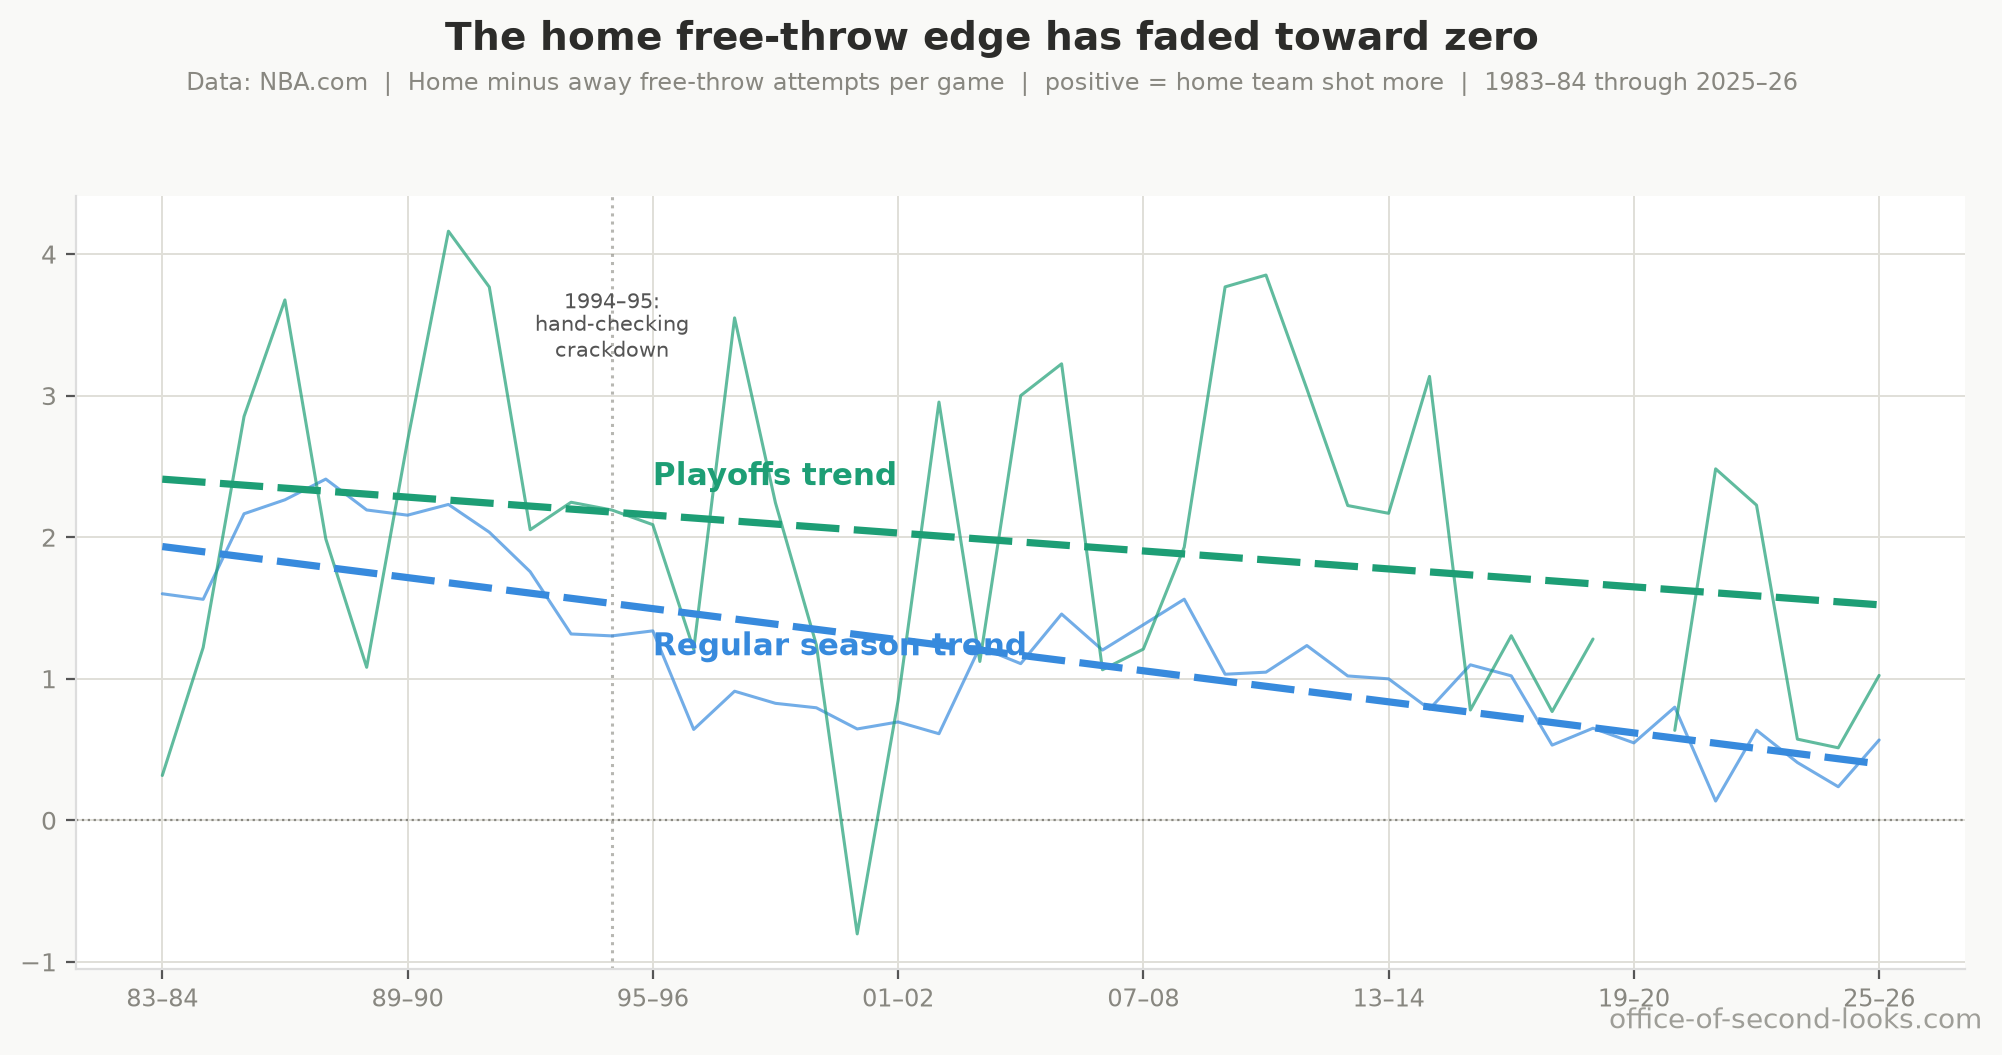
In every period of the record, in both the regular season and the playoffs, referees have called fewer fouls on home teams. In the 1980s and early 1990s, home teams averaged about 1.2 fewer foul calls per game in the regular season, worth roughly 2 extra free throw attempts a game. In the playoffs the edge was wider: about 1.6 fewer fouls and 2.4 more free throws. With fouls go free throws, and with free throws go points. Home teams have historically come out ahead on all of the four factors: shooting, rebounding, turnovers, and fouls. The foul edge is the one that comes straight from the referee rather than the players.
Then the friendly whistle faded
The drop, in free-throw terms: home teams once attempted about 2 more free throws per game than visitors; now it is just under half a free throw. The playoffs moved the same way but less: the foul gap fell from 1.6 to about 0.7, the free-throw advantage from 2.4 to 1.1 attempts. As everywhere in the whistle’s story, the postseason lagged behind.
Part of the decline has a simple likely explanation: three-point attempts draw fewer fouls than drives to the basket, so as both teams moved to the arc there were fewer foul calls to go around, and the home team’s gap shrank with them. That change in shot selection accounts for about half of the regular-season foul decline; The Three-Point Suspect makes the full case that the same move to the arc explains close to half of the entire decline in home court advantage, not just the foul part of it. The other half of the foul decline isn’t explained by the change in shot selection, and the most likely candidate is a change in how referees call the game.
We don’t know why referees called a more even game. A change in who officiated, league training, or something else could have played a part. The league-wide foul counts show the change in both the regular season and the playoffs; the playoff-only records for individual officials are examined below.
How a two-attempt advantage ever mattered
In the 1980s and early 1990s the home team attempted about 2 more free throws a game than the visitor. Those were attempts, not points: once you subtract the misses, they were worth about a point and a half. That seems too small to decide anything.
On any single night, free-throw attempts swing much more than that small average edge. In the 1980s and early 1990s, the middle 80% of regular-season games ran from -12 to +16 more attempts for the home team, around an average of +1.97. The swing has narrowed only a little since then; the average has slid most of the way to zero.
📊 Left: the 1983-84 regular season’s per-game FTA gap, a wide noisy spread with the season…
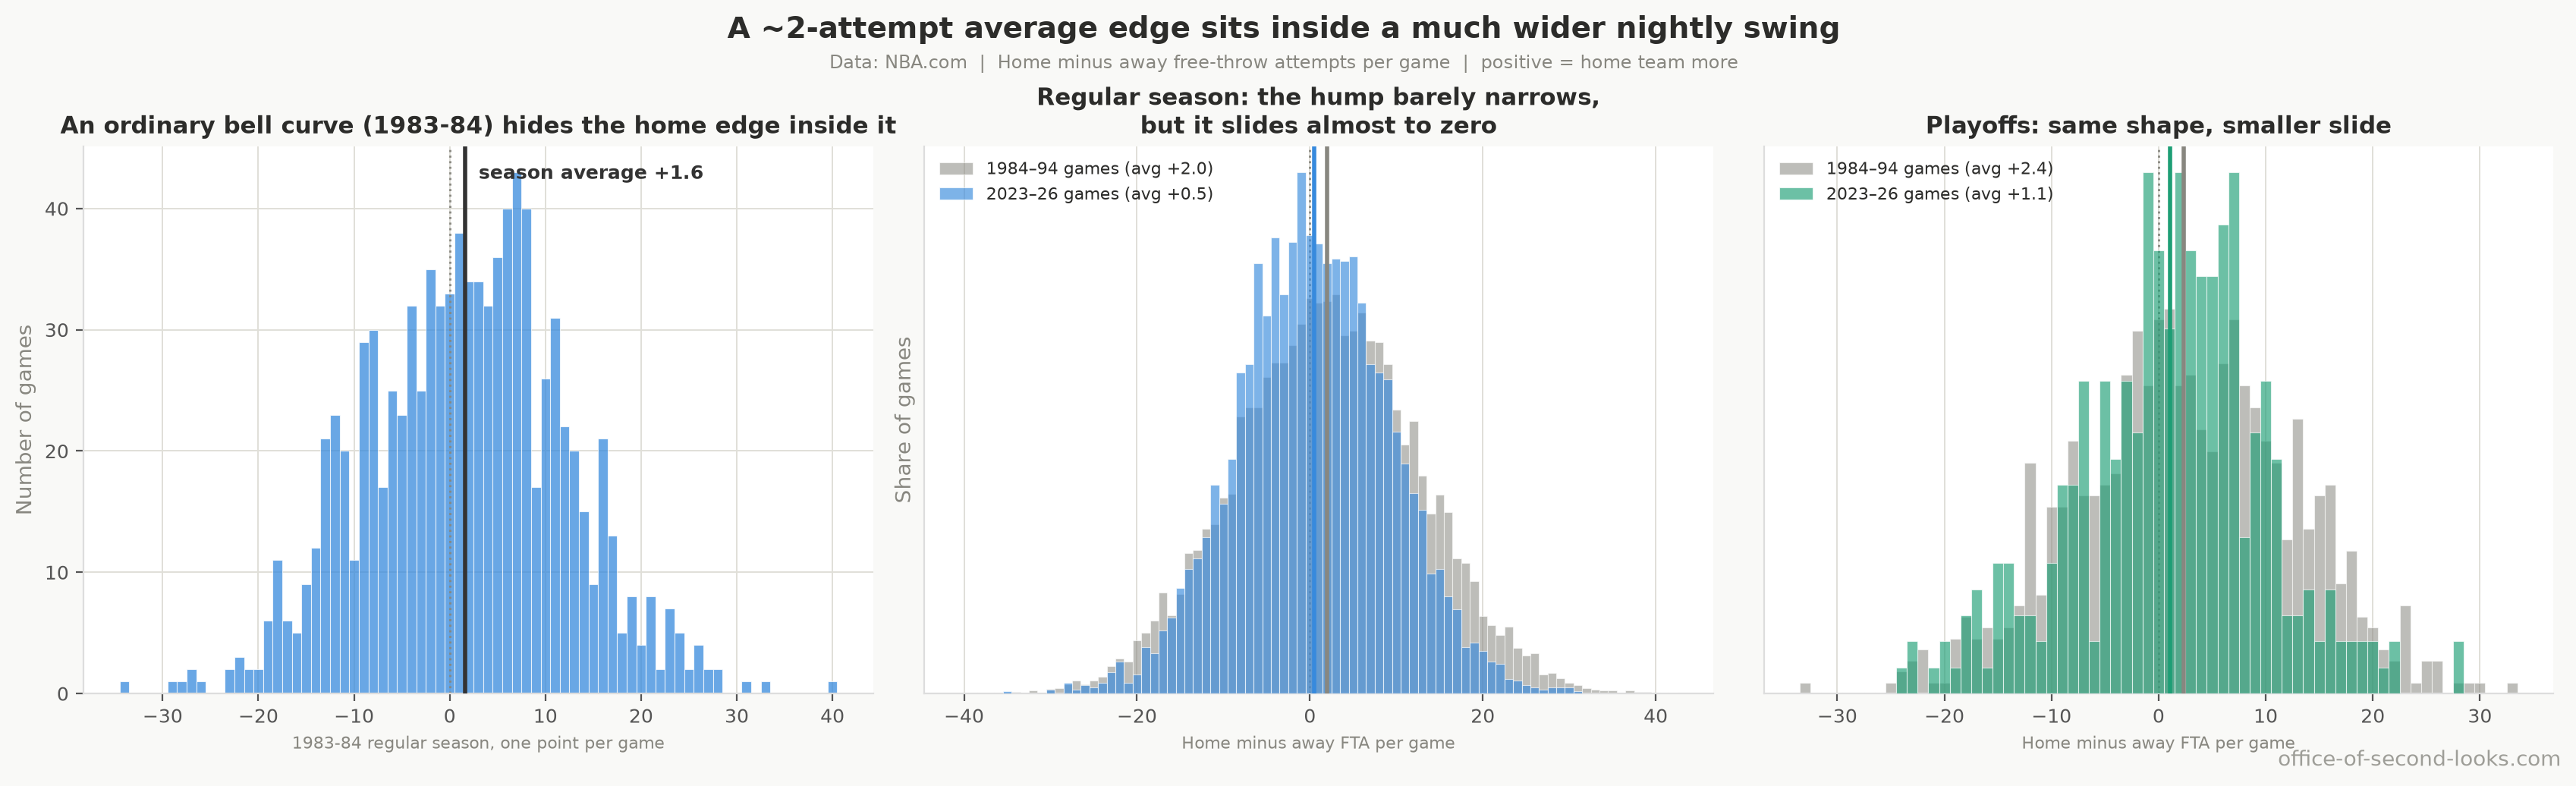
So how can an edge this small tilt wins? Most games are decided by much more than that scoring edge, but some are within a possession. The extra scoring rarely changes a rout; across a season it can flip enough close games to move the home win rate.
Among games decided by four points or fewer, home teams won about 55% from 1984 to 1994 and about 50% today. Sorting games by their final margin cannot tell us which ones the whistle flipped, but the same close-game measure shows how the edge faded.
📊 Home team win % per season: all regular-season games (grey) against games decided by four…
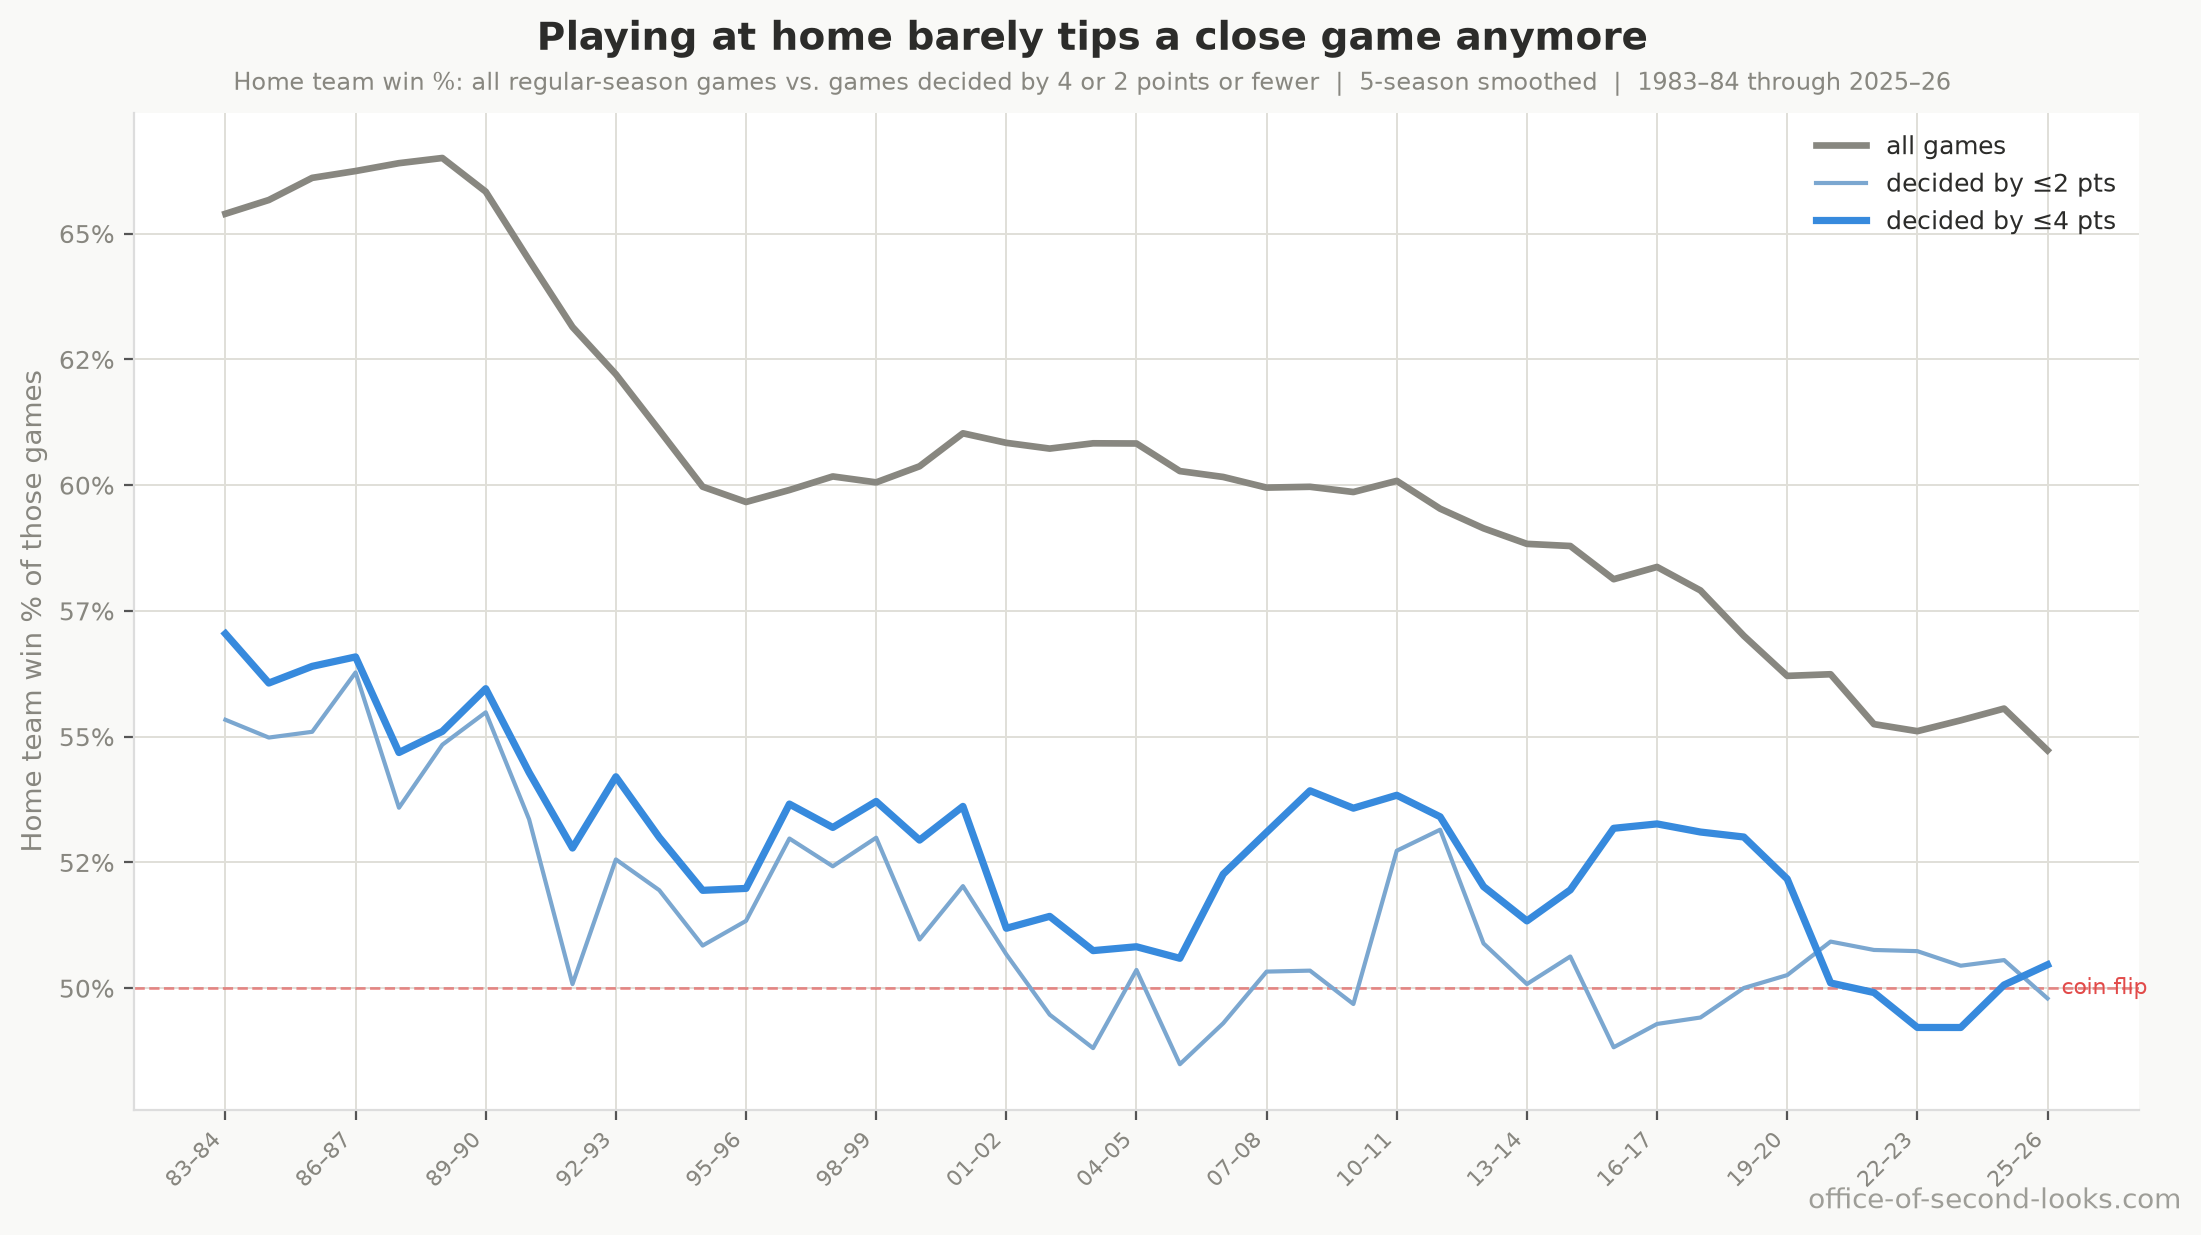
The whistle’s small average edge emerges across thousands of games, even while one night’s free-throw count can swing either way.
What the individual playoff referees show
The league-wide trends above include regular-season and playoff games. The individual-official records here cover playoff games. They show officials’ calls leaning less toward the home team in later seasons, but they cannot tell whether a change in personnel, training, or something else caused the league-wide decline.
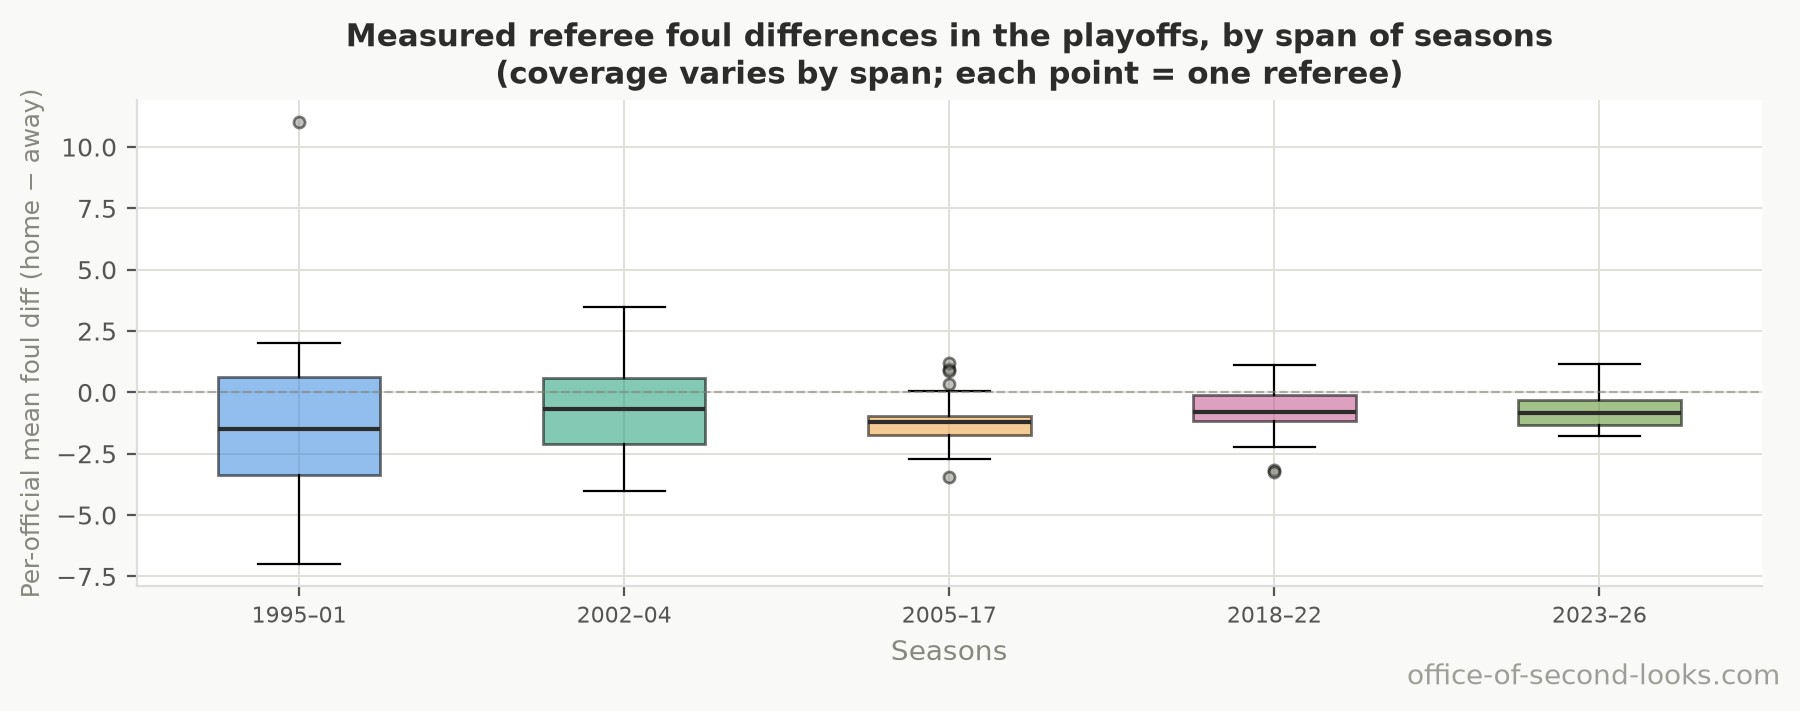
Per-official records only begin in 1995, so the 1980s and early-1990s baselines above come from the overall foul gap, not from individual referees. That first box is also the thinnest: the league lists officials for only 36 of the 496 playoff games played between 1995 and 2001, and the games it does list drew more fouls on the visitors than those seasons’ playoff games as a whole, so read the leftmost box as the handful of nights we can see rather than as all of 1995–2001.
Do some referees favor the home team more than others? Yes, but by less than a raw leaderboard suggests. Individual referees still differ from one another by about as much as the league-wide edge that is left, though much of that raw spread is the random bounce of short careers. Of 47 officials with at least 50 playoff games, 45 lean the home team’s way on fouls, nearly all tilting the same direction. After adjusting for how few games some officials worked, the most home-leaning officials on record sit roughly a full foul per game apart from the most even-handed (the chart below names both groups). About 60% of the raw, unadjusted spread was that same random bounce of short careers. Even allowing for the fact that testing all 47 officials at once turns up some false positives by chance, 29 of the 47 stand out on their own: the differences are real, just smaller than the leaderboard suggests. This measures tendencies, not proof that any one official decides games.
📊 Top/bottom 15 referees ranked by home foul differential (≥50 playoff games). Values are…
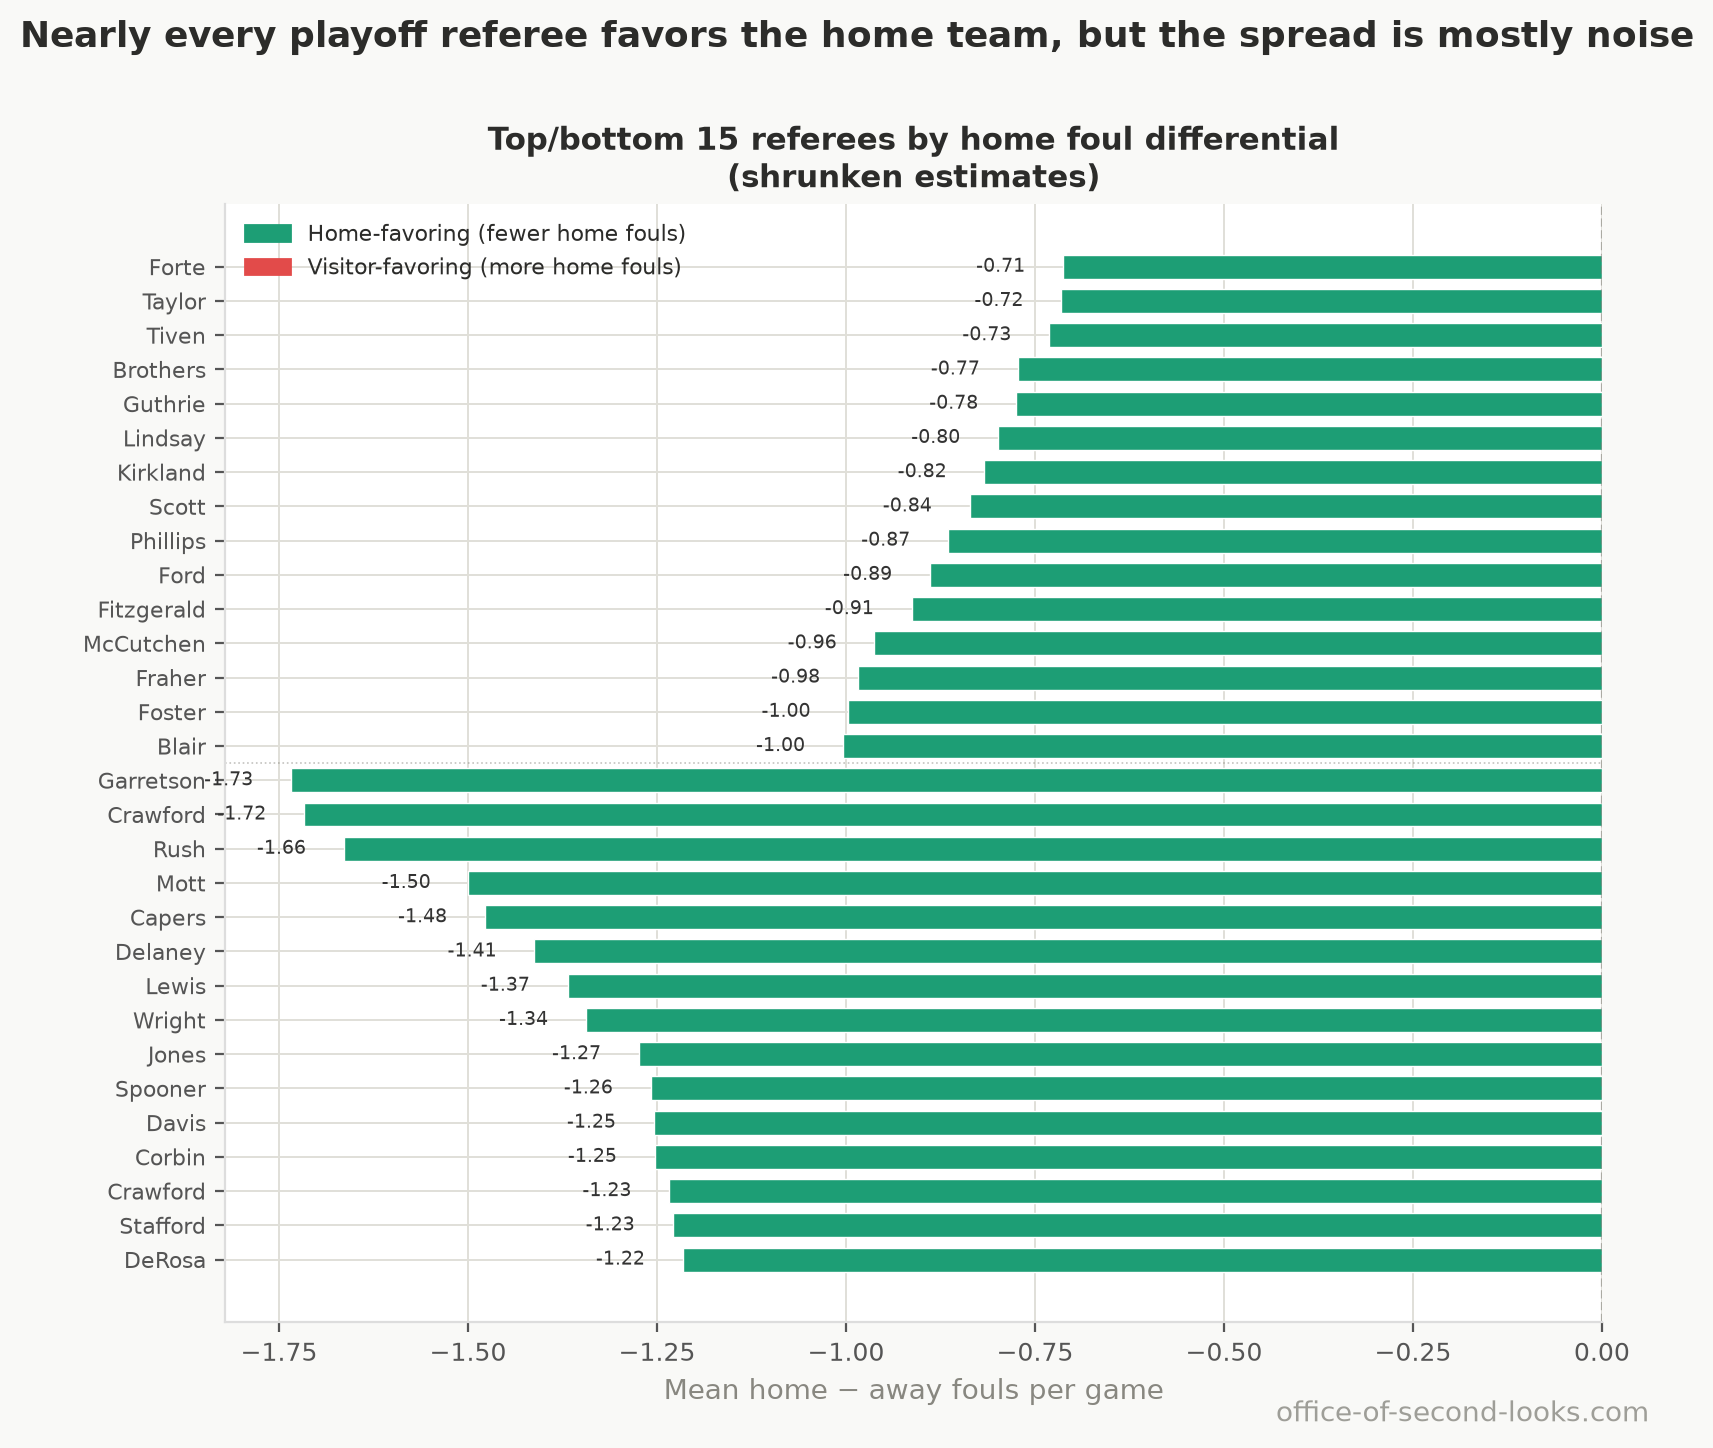
The whistle is the cleanest-cut part of the story: a real, repeatable bias that nearly every long-serving playoff referee shared, that faded for one reason I can measure and one I can only point at, and that was always too small to see on any single night. The next article asks how much of the decline the move to the arc explains, foul calls included.
Next: The Three-Point Suspect. It’s the obvious culprit, and the 40-year chart looks damning, but it closes less of the case than the chart suggests.
Back to the series hub: The Disappearing Home-Court Advantage
Data: NBA.com Stats, pulled with the open-source nba_api tool; attendance records from Basketball-Reference.