
Part 6 of a series on the NBA’s fading home court advantage; start with Home Court Advantage Is Fading.
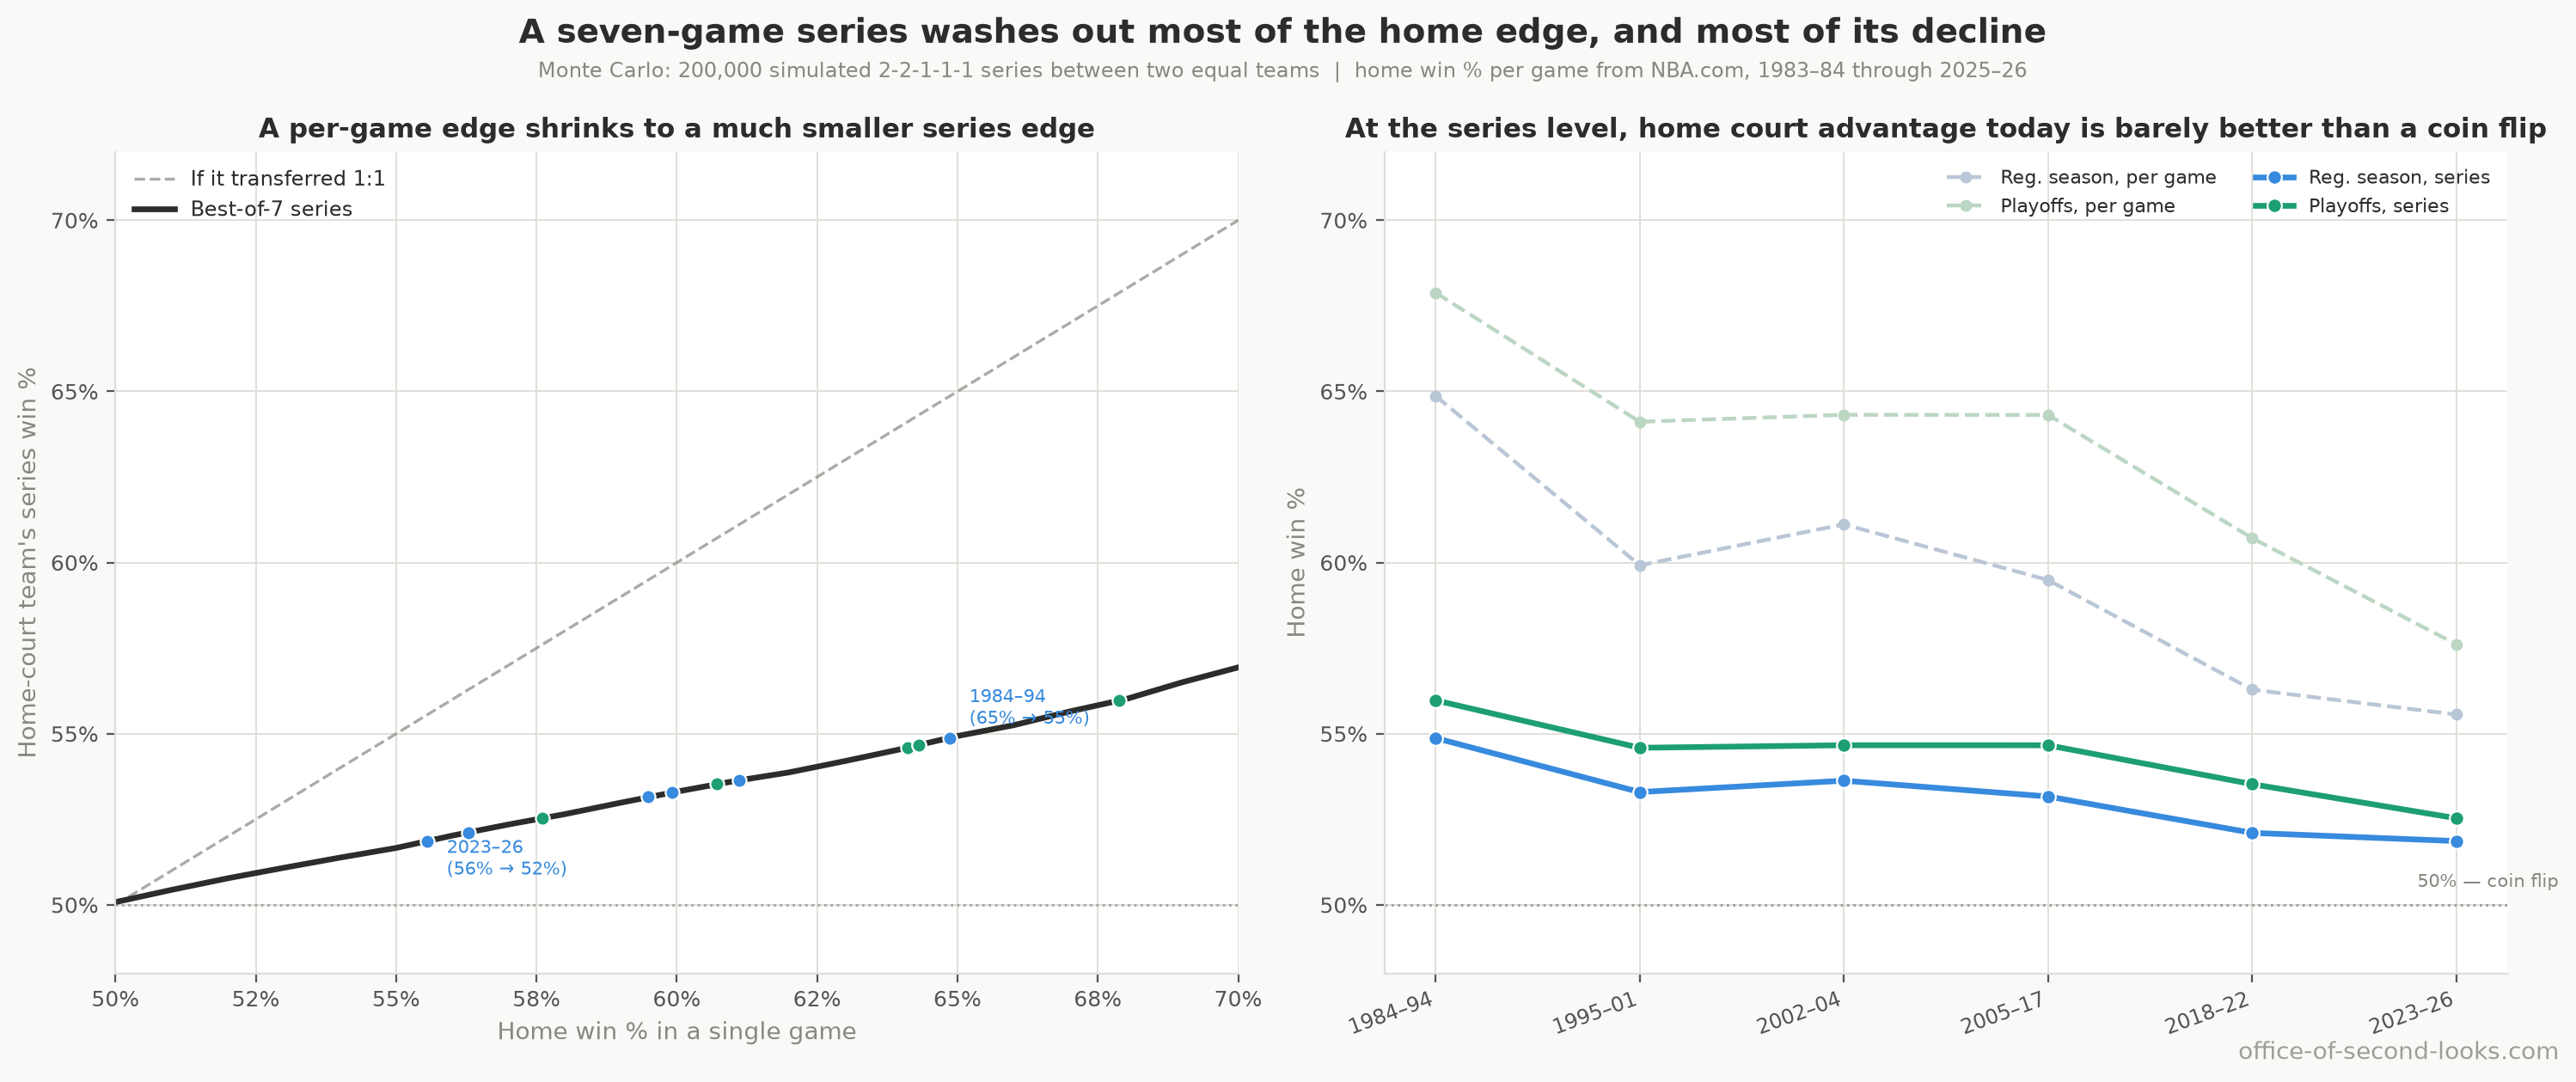
Imagine a best-of-seven between two equally matched teams with today’s regular-season home edge. The team with home court wins about 52% of those series, barely better than a coin flip. In a typical playoff game the building has mattered more than the quality gap between the two teams. Seven games dilute that edge without erasing it.
The playoff home win rate averaged about 68% in 1984–94, then about 64% in each period from the mid-1990s through 2017. The later periods were lower again: about 61% in 2018–22 and 58% in 2023–26. These averages describe an earlier fall, a long middle plateau, and a further recent fall; the smaller postseason sample cannot reliably identify a turning year. A separate comparison of the last four postseasons with the earlier record shows the gap between favorites’ and underdogs’ home win rates narrowing. Most of that narrowing came from the favorite, the team that earned home court with the better record: it wins less often at home than it did through 2022, while its weaker opponent’s home rate has slipped only a few points, to about a coin flip. That rests on only the four most recent postseasons, so it describes the latest seasons rather than a settled trend.
Seeding and series format also change how a home edge shows up in playoff results.
Seven games shrink the edge
The estimate comes from playing out best-of-seven series between equal teams, using the regular-season home win rate for each game. In the 1980s that rate was about 65%, enough to give the home-court team about a 55% series chance. With today’s rate near 56%, the chance is about 52%. The format leaves the team with home court roughly a third of its single-game edge, and the decline in that edge carries through to the series too. These are illustrations of what the game-by-game rate implies, not forecasts of real matchups: the calculation treats each game as a fresh start, and playoff home rates also reflect better teams hosting more often.
📊 Playoff home win % by game within a series (G1–G7), all seasons pooled. The sawtooth…
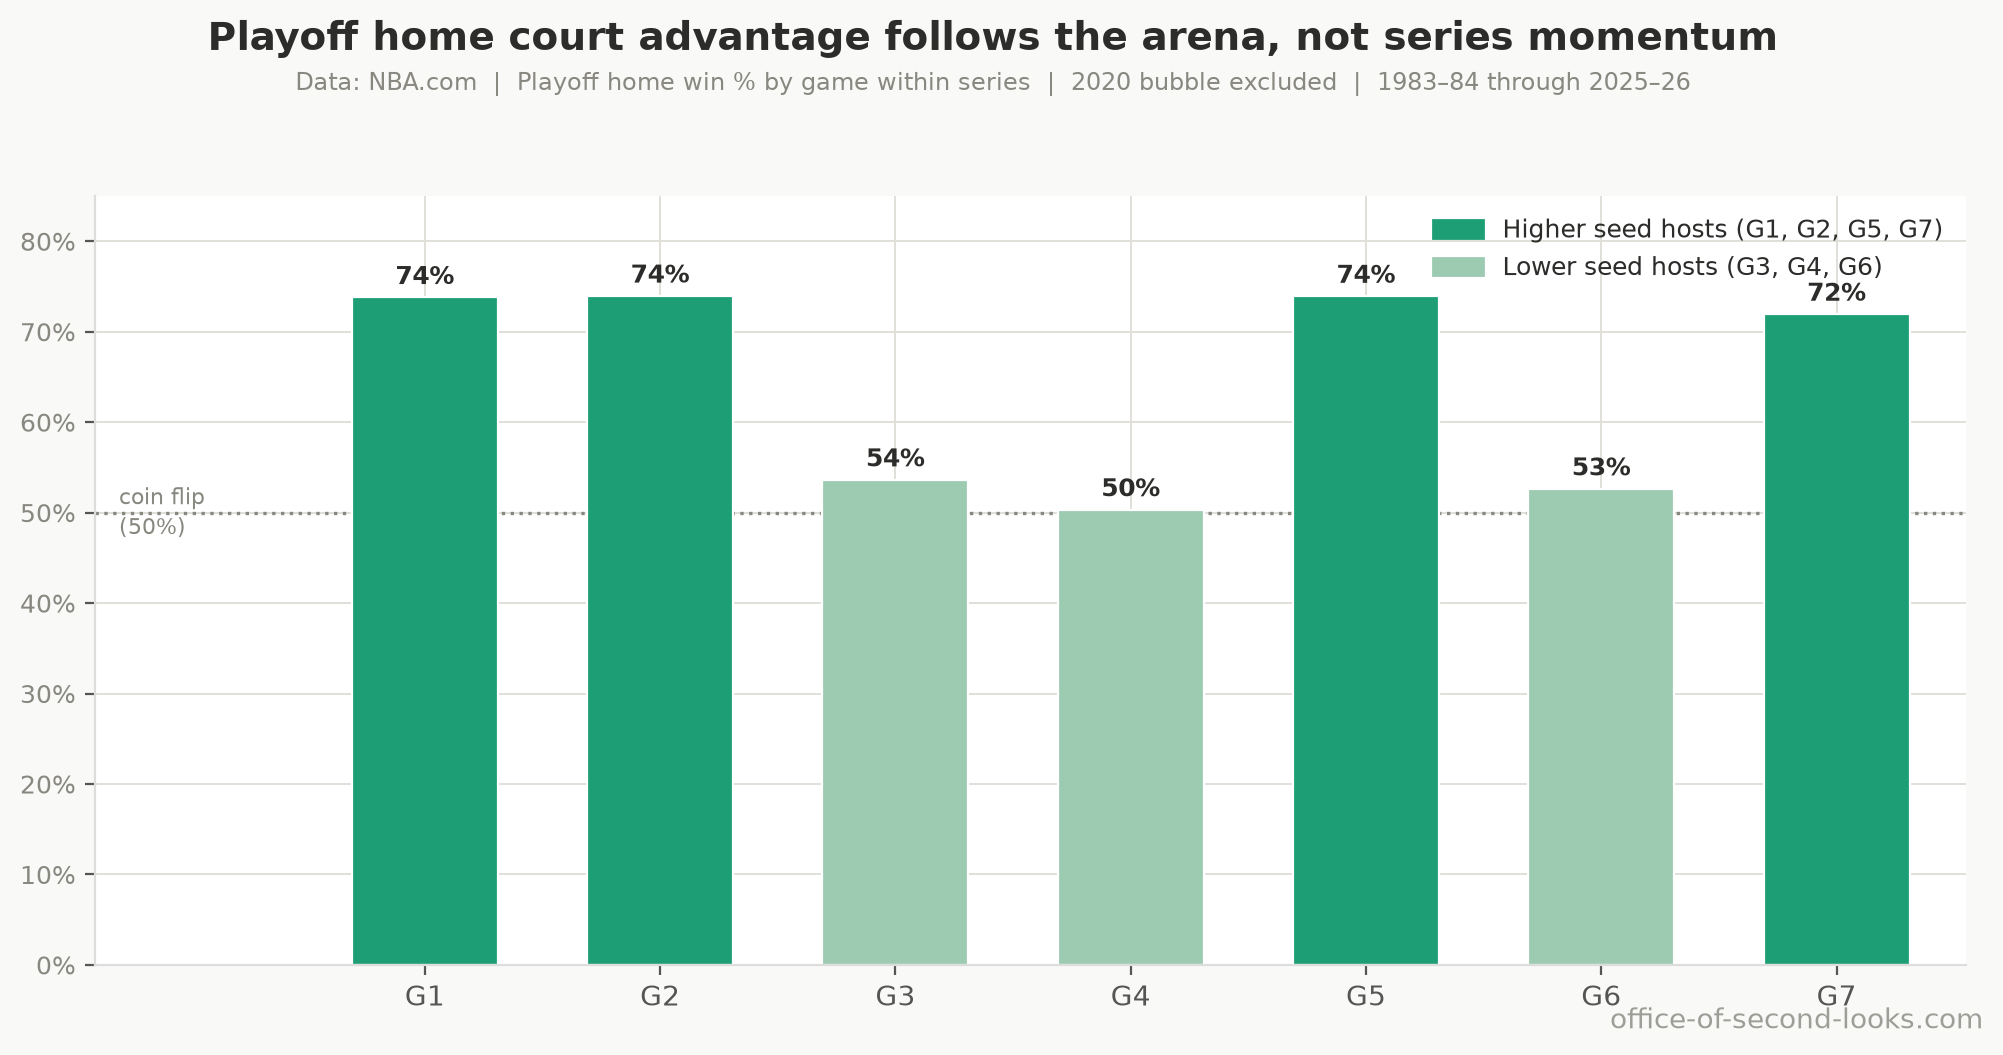
Game 7 is worth about as much to its host as Game 1. The edge does not simply wear off as a series goes deeper.
The favorite’s edge held, then shrank
Split every playoff game by which team hosted it. In the 1980s and 1990s, the lower-seeded team, the weaker opponent, won 56% and 52% of their home playoff games. Put as a difference, the higher seed’s home win rate ran about 21 percentage points above the lower seed’s in the 1980s, and stayed 21–24 percentage points above it in every period through 2022. Playing at home never let the lower seed close that gap.
From the early 2000s onward the lower seed’s home rate sat at 47–52%, while the higher seed’s, which held at 72–77% from the 1980s through 2022, eased to about 65% in recent seasons. So the gap, which peaked at 24 points, is down to 16 over the last four postseasons. Most of that narrowing came from the favorite: measured against its own level through 2022, the higher seed’s home rate fell more than twice as far as the lower seed’s. The weaker host’s rate barely moved from where it had sat since the early 2000s, and is about a coin flip now. Both readings rest on those four postseasons alone, fewer than two hundred home games per side, so they describe the latest seasons, not a trend the data has pinned down.
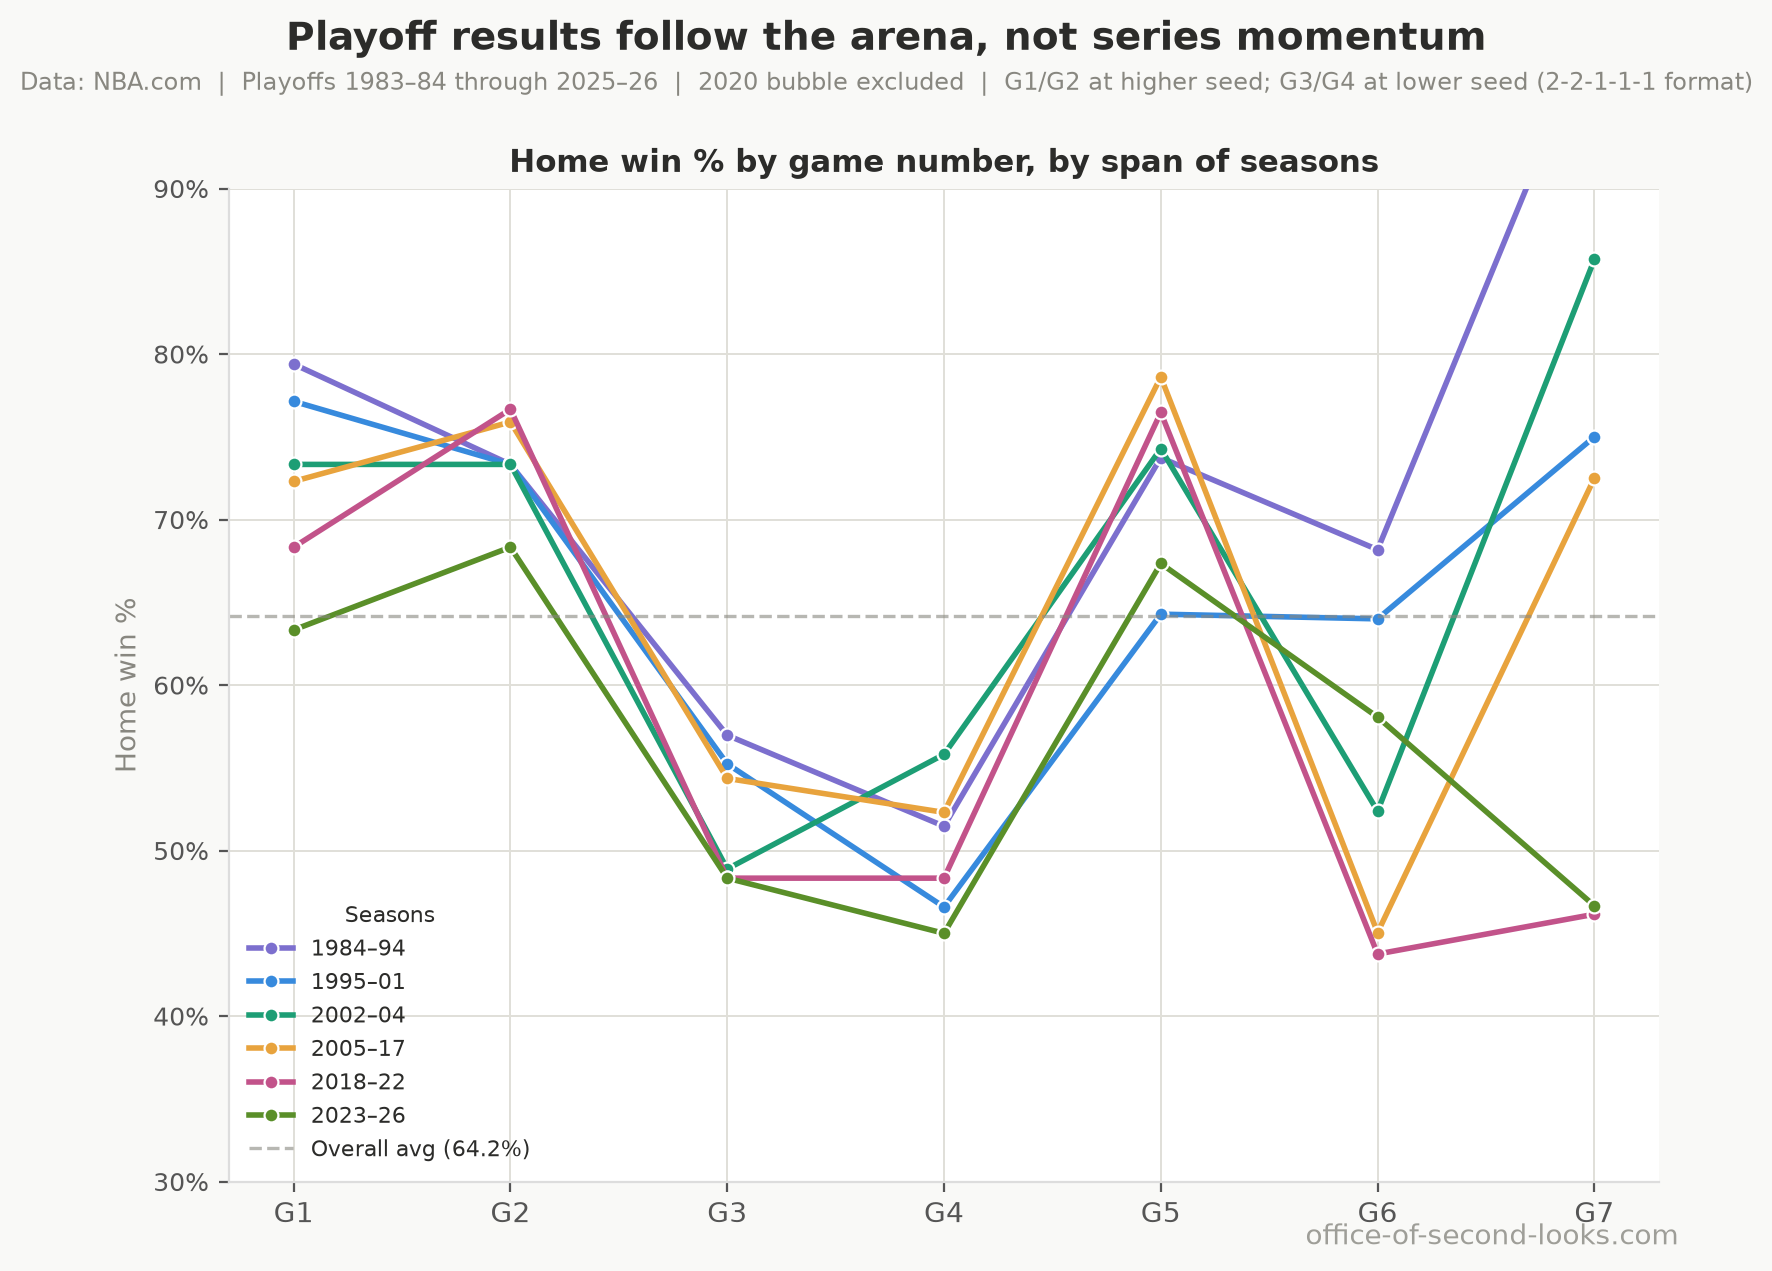
📊 The G1–G7 breakdown from the chart at the top, broken out by period, one line each. The…
Is it just weaker seeds, or a real decline in home court advantage?
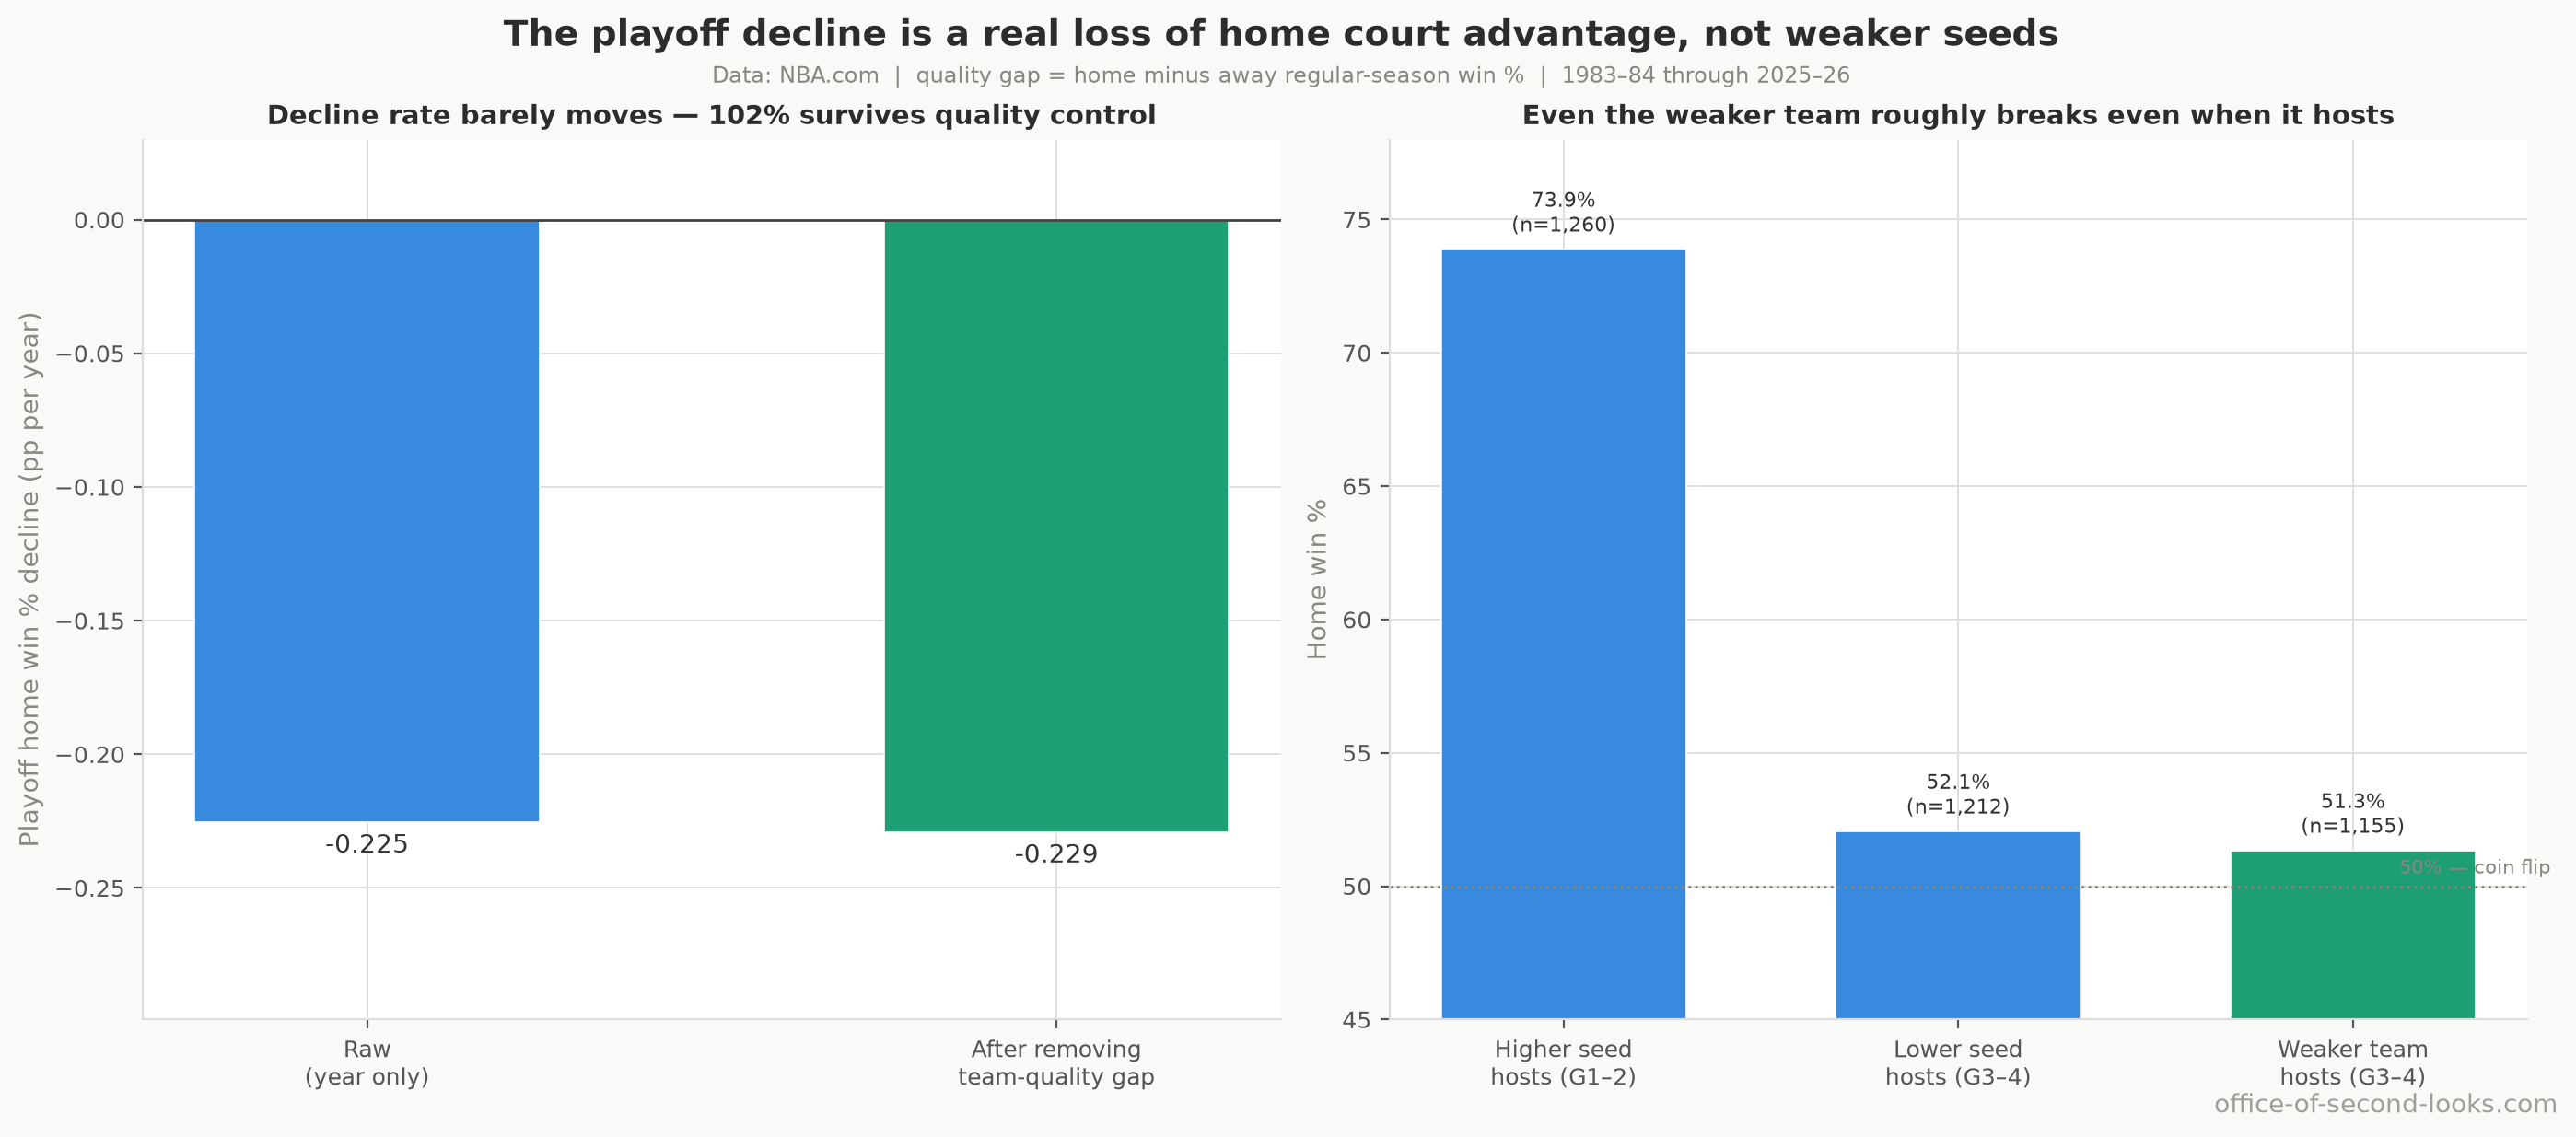
A fair objection: maybe playoff home teams win less now simply because top seeds, judged by their regular-season records, no longer outclass their opponents the way they once did. The data says no. Strip out the quality gap between the two teams and the year-by-year playoff decline doesn’t budge; none of it is explained by the two teams being more evenly matched. The cleanest test isolates the genuinely weaker team by regular-season quality: when the objectively weaker team hosts Games 3 and 4, it wins about half the time, when on talent alone it should lose. The building roughly cancels the talent deficit in that game, though it never lifts the weaker team to the favorite’s own home rate.
📊 The playoff decline is a genuine weakening of home court advantage, not weaker seeds.…
The regular season gives a longer view of the favorite-versus-underdog split. Stronger home teams have lost about twice as much of their win rate as weaker home teams across the full record, while the playoff split has narrowed only in the last four postseasons. Those few playoff years cannot yet tell us whether the postseason has joined that longer trend. The comparison and the paper that prompted it are in Related Work.
The timing is uncertain
The recent fall is only part of the playoff history. The rate had already fallen from its earliest-period average before the long middle plateau. The analysis locates a bend in the regular-season decline somewhere in the 1990s, but cannot reliably date a playoff bend. Because each postseason rests on far fewer games than a full regular season, the direction of the playoff decline is clear but its exact size is not. The 2014 playoff format change doesn’t explain it: once the long decline is allowed for, the format break adds nothing detectable, an alibi covered in full in The Usual Suspects.
In the playoffs, arenas can’t be told apart
One more playoff twist, covered in full in The Altitude Exception: the real spread between franchises that shows up in the regular season can’t be detected in the postseason, where the fewer than 150 games most buildings have hosted can’t separate one arena from another. Yet the common advantage every host shares runs larger in the playoffs than in the regular season. That is the playoff paradox in one line: the differences between buildings drop below what the games can detect, and the measured edge of being at home at all is bigger, though seeding accounts for some of it.
Next: The Altitude Exception. Denver and Utah still have the league’s biggest regular-season home edges, even though both edges shrank.
Back to the series hub: The Disappearing Home-Court Advantage
Data: NBA.com Stats, pulled with the open-source nba_api tool; attendance records from Basketball-Reference.