
Part 4 of a series on the NBA’s fading home court advantage; start with Home Court Advantage Is Fading.
The biggest single part of the regular-season decline is the one I cannot explain: rebounding. Home teams used to grab more of their own misses than visitors did; that edge has almost disappeared. Rebounding accounts for about 30% of the decline. The home turnover edge has also shrunk; the rise in threes explains part of that loss, but not why visitors closed the rest of the gap.
The rise in threes barely changes the rebounding result: in games with similar three-point rates, the home rebounding edge still fades. That leaves a clear change in results without a clear cause.
What happened: the home rebounding edge shrank, and nearly vanished on the offensive glass
The home team’s rebounding advantage has shrunk steadily for 40 years, at both ends of the floor. The home advantage on defensive rebounds fell from about +1.6 boards per game in the 1980s to roughly +0.6 today, a drop of about a full board. The home advantage on offensive rebounds fell from about +0.6 to slightly below zero.
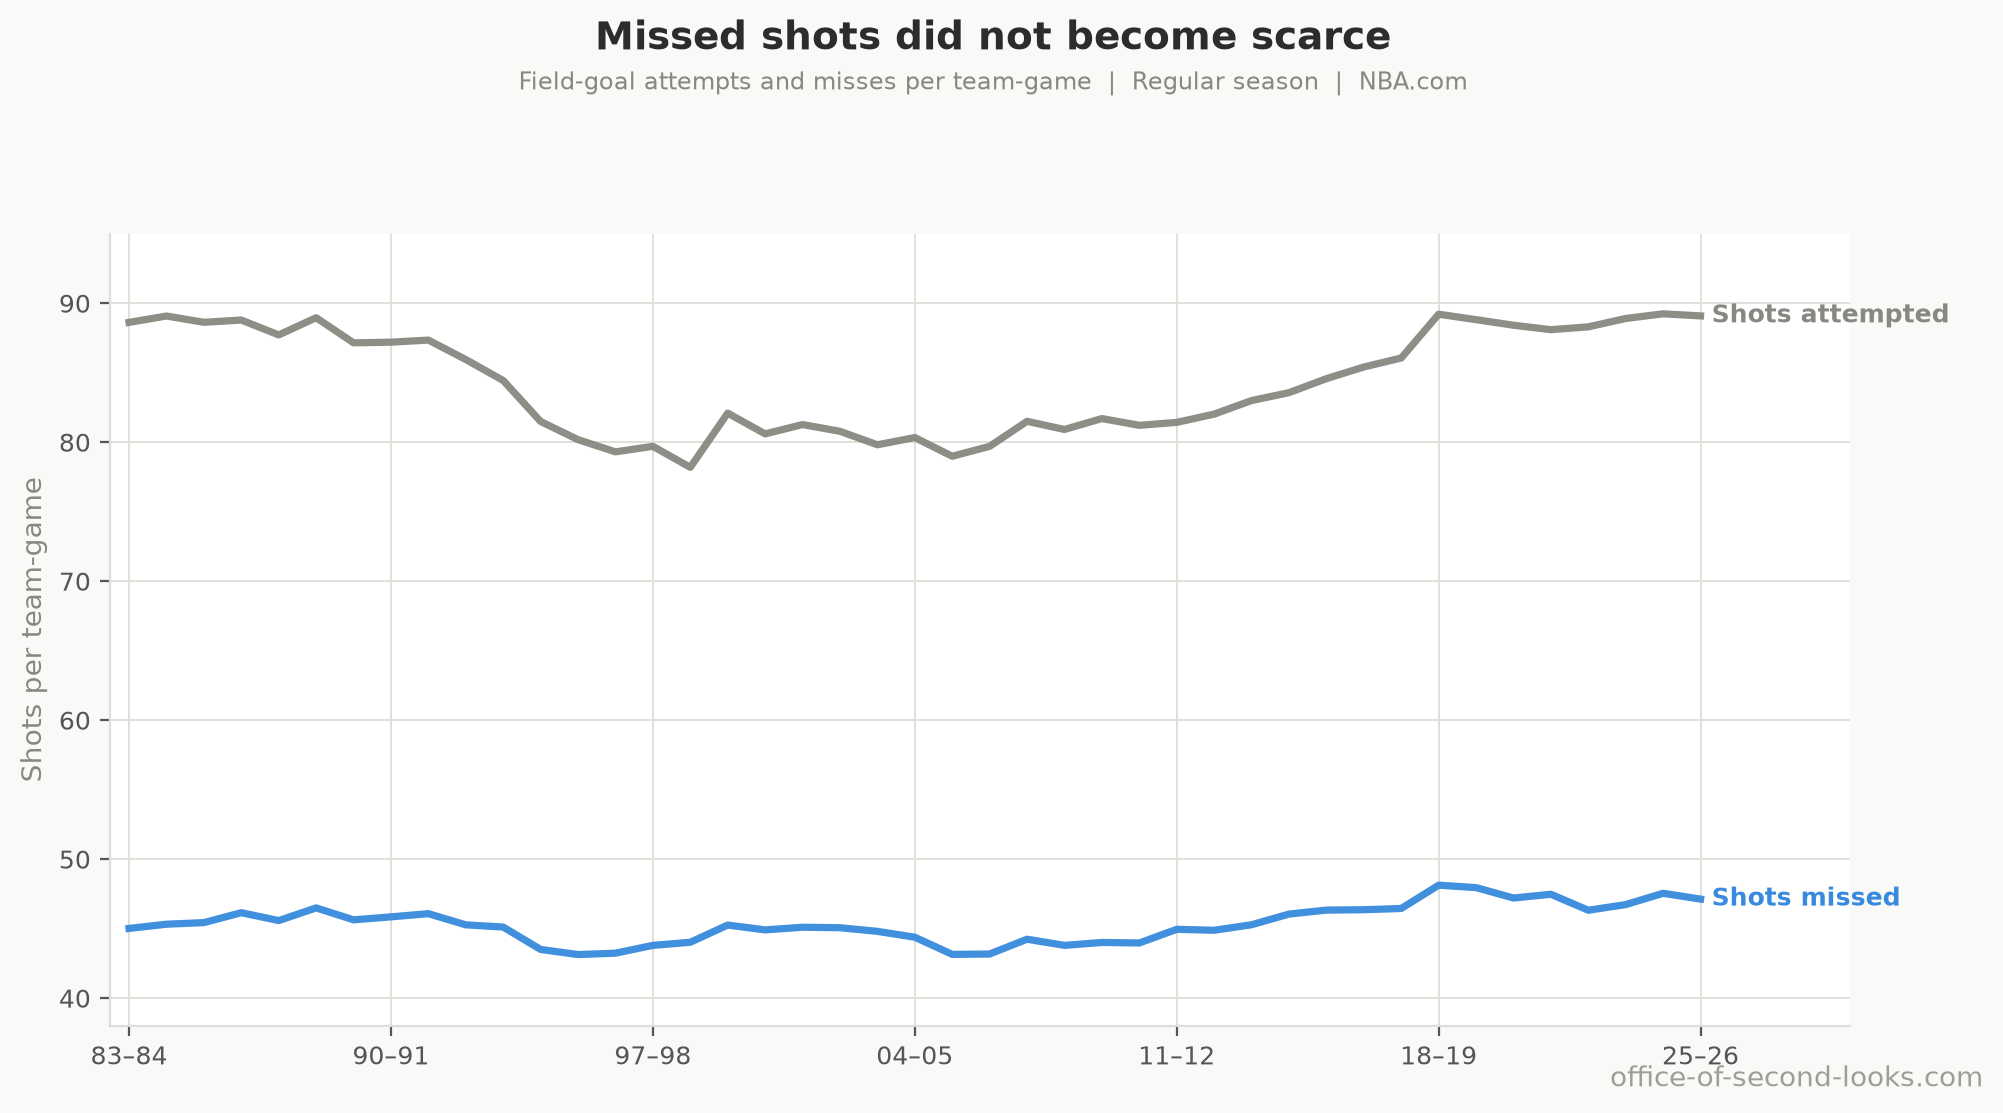
Fewer chances to rebound cannot explain the loss: teams missed about 45 shots a game at the start of the record and 47 in the latest season. The league scores more points per shot because more makes are threes, but a smaller share of field-goal attempts go in.
📊 Field-goal attempts and missed field goals per team-game across regular seasons. Misses…
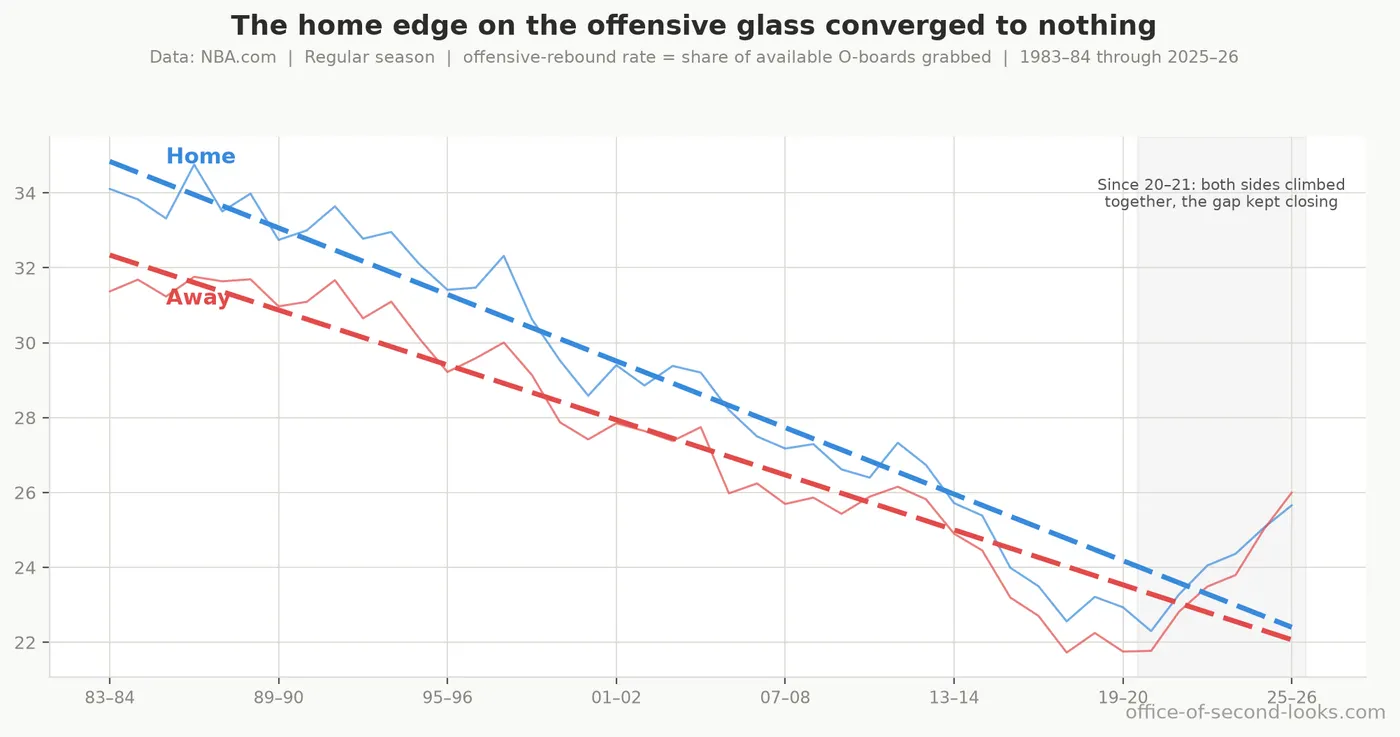
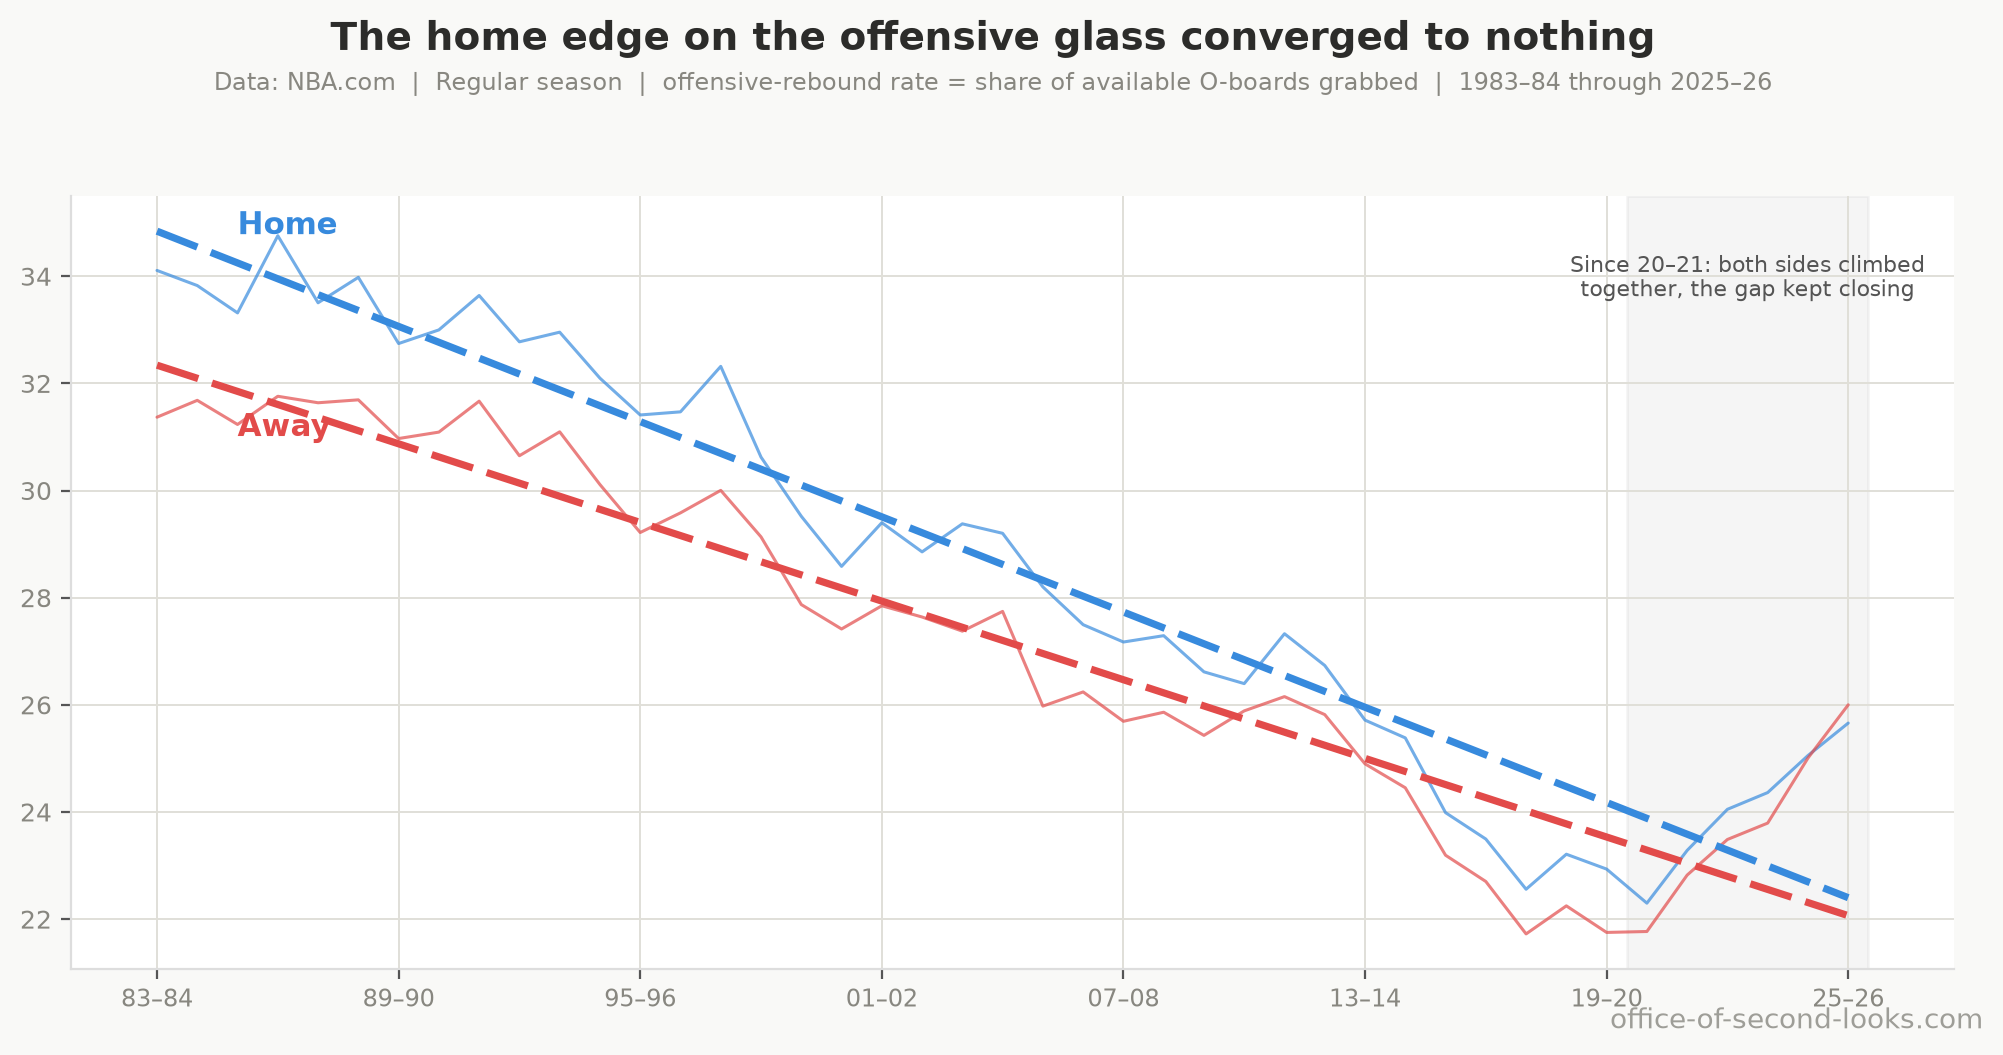
To compare rebounding success while the number of chances changes, use the offensive-rebound rate: the share of its own missed shots each team grabs back. League-wide, that share fell from 33% in the 1980s to 26% today.
On that share-of-misses measure, the home-versus-away gap is clear. In the mid-1980s, home teams grabbed about 34% of their own misses; away teams grabbed about 31%. Both rates fell, but the home rate dropped 8 percentage points while the away rate dropped only 5. The two lines converge and cross by 2025–26. The gap closed not because visitors got better on the offensive glass, but because the home rate fell further. The rates do not tell us how hard either side tried. The chart bends upward at the end because both home and away offensive-rebound rates have risen in recent seasons, even as the gap between them kept closing.
Why the home rate fell farther I do not know and cannot figure out with the data I can find. The usual explanations are strategic (teams choosing transition defense over second chances) or about the crowd (once teams everywhere stopped crashing the glass, a home crowd had less effort to spur). These are plausible explanations, not conclusions this analysis can establish.
What can the cameras tell us?
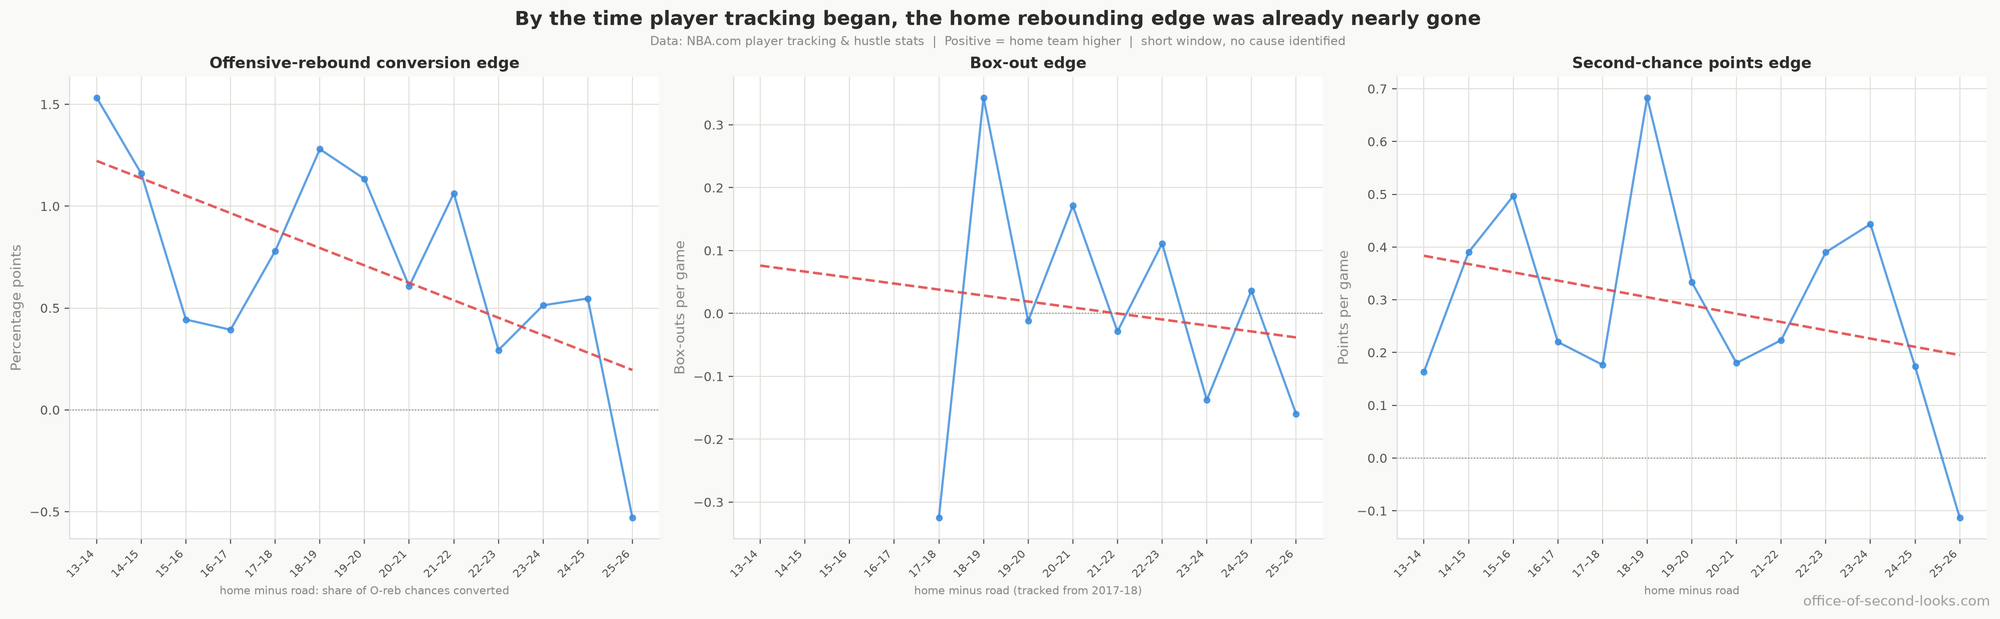
The cameras have tracked rebounds since 2013–14, long after much of the home edge had faded. Their offensive-rebound measure points in the same direction as the box score, while box outs and second-chance points show no clear home trend. Judged together, none of those three recent trends is firm on its own, and none tells us whether teams changed their effort, positioning, or tactics.
📊 The modern player-tracking view of the home rebounding advantage (2013–14 on; box-outs…
Turnovers: the same quiet fade, half of it also a mystery
Home teams also used to commit fewer turnovers than visitors. That gap’s decline accounts for about 27% of the regular-season decline in home court advantage, nearly as much as rebounding. It belongs here because the part threes don’t explain, a road-team improvement, is another change we can measure but cannot fully account for.
Averaged across the full 40-year span, home teams committed about 0.4 fewer turnovers per game than visitors, starting near 0.8 in the first decade of the record; that gap has nearly closed. About half of that fade disappears once games are compared at the same three-point rate. One plausible reading is that three-point attempts generate fewer live-ball turnovers than drives and post play, so as both teams moved out to the arc the absolute number of turnovers fell league-wide and the home team’s advantage shrank with it; that’s an interpretation, not something I tested. Across the record, the fade was partly road-specific: road teams’ extra turnovers per 100 possessions fell from 0.85 to 0.13, as away turnovers fell faster than home ones. What the data can’t settle is why road teams improved. Better scouting and video preparation might help visitors handle unfamiliar defenses, but this data cannot test that idea.
📊 How the home rebounding and turnover advantages faded. Left: the raw home-minus-away…
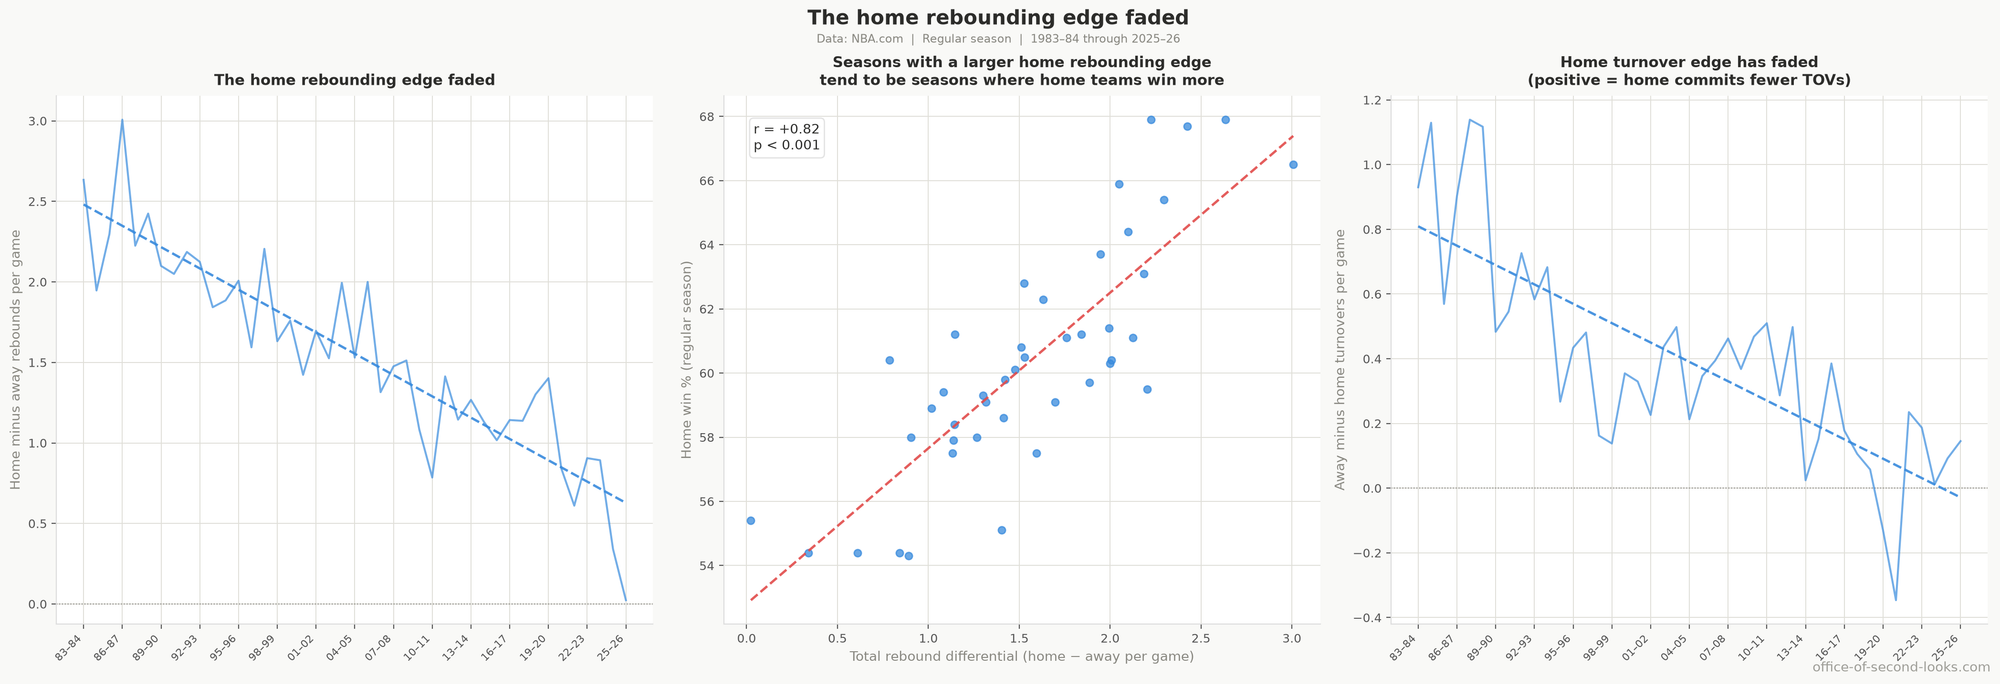
The rebounding and turnover losses might share a cause, perhaps better preparation on the road. That remains a guess; the record measures the gaps closing, not why they closed.
The playoffs provide a useful check on these two findings. The home rebounding edge fell there too, by roughly three-quarters, but the postseason has far fewer games. The playoff turnover trend is too uncertain to call. The Playoffs Are Different (and the Same) handles what playoff seeding and series format do to the home advantage.
The rebounding and turnover gaps both narrowed. We can describe the change; we cannot fully explain what caused either gap to close. The next article turns to the suspects that looked guilty and mostly weren’t: travel, rest and rule changes.
Next: The Usual Suspects. Travel, rest, crowd size, and nearly every rule change: the suspects that looked guilty and turn out to have alibis.
Back to the series hub: The Disappearing Home-Court Advantage
Data: NBA.com Stats, pulled with the open-source nba_api tool; attendance records from Basketball-Reference.